In my article "Simulation in SAS: The slow way or the BY way," I showed how to use BY-group processing rather than a macro loop in order to efficiently analyze simulated data with SAS. In the example, I analyzed the simulated data by using PROC MEANS, and I use the
Tag: Tips and Techniques
I recently showed someone a trick to create a graph, and he was extremely pleased to learn it. The trick is well known to many SAS users, but I hope that this article will introduce it to even more SAS users. At issue is how to use the SGPLOT procedure
A SAS customer asks: How do I use SAS to generate multiple samples of size N from a multivariate normal distribution? Suppose that you want to simulate k samples (each with N observations) from a multivariate normal distribution with a given mean vector and covariance matrix. Because all of the
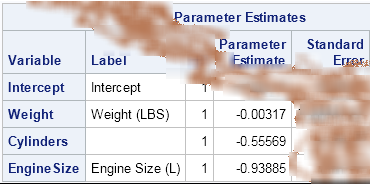
Argh! I've just spilled coffee on output that shows the least squares coefficients for a regression model that I was investigating. Now the parameter estimate for the intercept is completely obscured, although I can still see the parameter estimates for the coefficients of the continuous explanatory variable. What can I
If you are like me, you've experienced the following frustration. You are reading the SAS/STAT documentation, trying to understand some procedure or option, when you find an example that is very similar to what you need. "Great," you think, "this example will help me understand how the SAS procedure works!"
Last week the SAS Training Post blog posted a short article on an easy way to find variables in common to two data sets. The article used PROC CONTENTS (with the SHORT option) to print out the names of variables in SAS data sets so that you can visually determine
The SAS/IML language secretly creates temporary variables. Most of the time programmers aren't even aware that the language does this. However, there is one situation where if you don't think carefully about temporary variables, your program will silently produce an error. And as every programmer knows, silent wrong numbers are
A while ago I saw a blog post on how to simulate Bernoulli outcomes when the probability of generating a 1 (success) varies from observation to observation. I've done this often in SAS, both in the DATA step and in the SAS/IML language. For example, when simulating data that satisfied
In a recent article on efficient simulation from a truncated distribution, I wrote some SAS/IML code that used the LOC function to find and exclude observations that satisfy some criterion. Some readers came up with an alternative algorithm that uses the REMOVE function instead of subscripts. I remarked in a
The LOC function is one of the most important functions in the SAS/IML language. The LOC function finds elements of a vector or matrix that satisfy some condition. For example, if you are going to apply a logarithmic transform to data, you can use the LOC function to find all