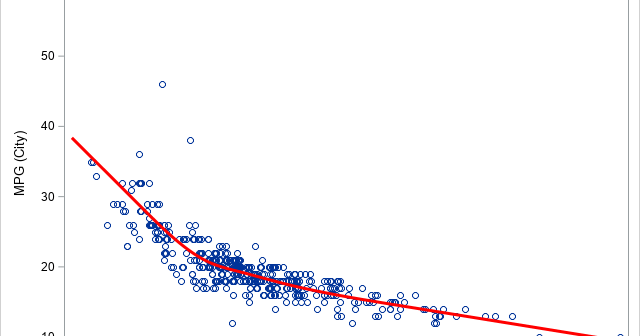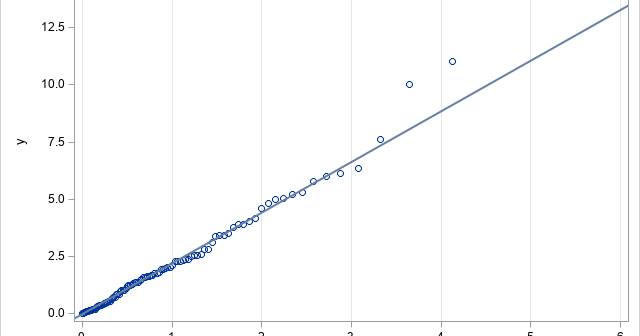
A frequent topic on SAS discussion forums is how to check the assumptions of an ordinary least squares linear regression model. Some posts indicate misconceptions about the assumptions of linear regression. In particular, I see incorrect statements such as the following: Help! A histogram of my variables shows that they
Tag: Data Analysis
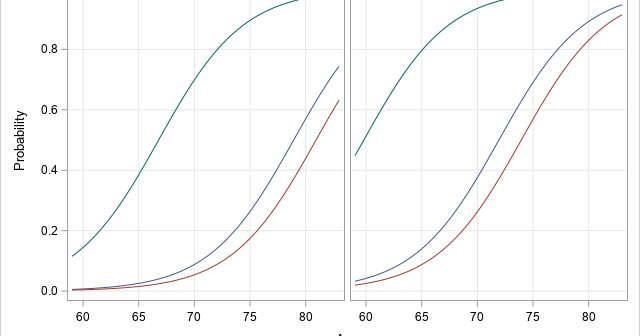
My colleague, Robert Allison, recently published an interesting visualization of the relationship between chess ratings and age. His post was inspired by the article "Age vs Elo — Your battle against time," which was published on the chess.com website. ("Elo" is one of the rating systems in chess.) Robert Allison's
This article shows how to score (evaluate) a quantile regression model on new data. SAS supports several procedures for quantile regression, including the QUANTREG, QUANTSELECT, and HPQUANTSELECT procedures. The first two procedures do not support any of the modern methods for scoring regression models, so you must use the "missing
When you use a regression procedure in SAS that supports variable selection (GLMSELECT or QUANTSELECT), did you know that the procedures automatically produce a macro variable that contains the names of the selected variables? This article provides examples and details. A previous article provides an overview of the 'SELECT' procedures
A programmer recently asked a question on a SAS discussion forum about design matrices for categorical variables. He had generated a design matrix by using PROC GLMMOD and wanted to use the design columns in a subsequent procedure. However, the columns were named COL1, COL2, COL3,..., so he couldn't tell
Back in SAS 9.3M2 (SAS/STAT 12.1), PROC FREQ introduced mosaic plots to visualize the joint frequencies in a contingency table. By default, the cells in a mosaic plot are colored according to levels of one of the categorical variables in the analysis. However, in 2013 I showed how you can
SAS enables you to evaluate a regression model at any location within the range of the data. However, sometimes you might be interested in how the predicted response is increasing or decreasing at specified locations. You can use finite differences to compute the slope (first derivative) of a regression model.
Which president of the United States is ranked the greatest by presidential historians? This article visualizes the results of the 2018 Presidential Greatness Survey, which was created and administered by B. Rottinghaus and J. Vaughn. They analyzed 166 responses from experts in political science who ranked the 44 US presidents
This article describes how to obtain an initial guess for nonlinear regression models, especially nonlinear mixed models. The technique is to first fit a simpler fixed-effects model by replacing the random effects with their expected values. The parameter estimates for the fixed-effects model are often good initial guesses for the
When you fit nonlinear fixed-effect or mixed models, it is difficult to guess the model parameters that fit the data. Yet, most nonlinear regression procedures (such as PROC NLIN and PROC NLMIXED in SAS) require that you provide a good guess! If your guess is not good, the fitting algorithm,