Tag: 13.1

Rick Wicklin 3
Overlay plots on a box plot in SAS: Discrete X axis

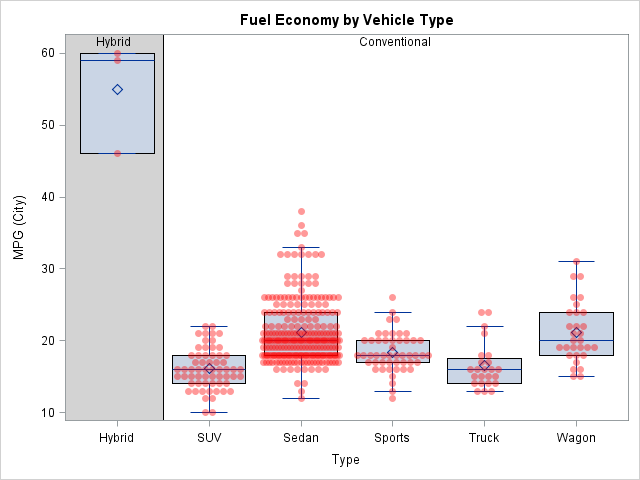
Box plots summarize the distribution of a continuous variable. You can display multiple box plots in a single graph by specifying a categorical variable. The resulting graph shows the distribution of subpopulations, such as different experimental groups. In the SGPLOT procedure, you can use the CATEGORY= option on the VBOX

Rick Wicklin 8
The WHERE clause in SAS/IML

In SAS procedures, the WHERE clause is a useful way to filter observations so that the procedure receives only a subset of the data to analyze. The IML procedure supports the WHERE clause in two separate statements. On the USE statement, the WHERE clause acts as a global filter. The

Rick Wicklin 19
What is the coefficient of variation?

I sometimes wonder whether some functions and options in SAS software ever get used. Last week I was reviewing new features that were added to SAS/IML 13.1. One of the new functions is the CV function, which computes the sample coefficient of variation for data. Maybe it is just me,

Rick Wicklin 9
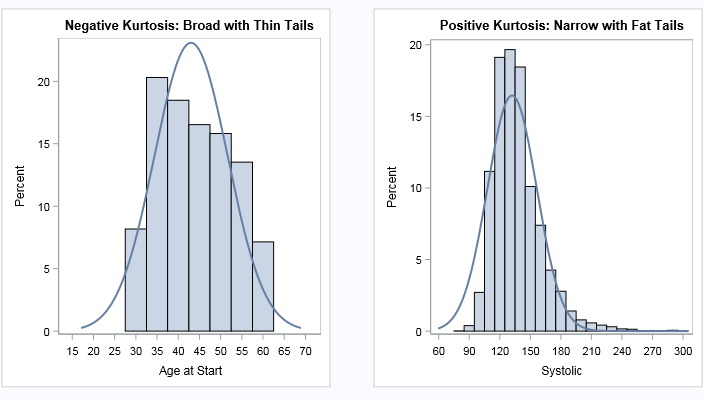
Does this kurtosis make my tail look fat?

What is kurtosis? What does negative or positive kurtosis mean, and why should you care? How do you compute kurtosis in SAS software? It is not clear from the definition of kurtosis what (if anything) kurtosis tells us about the shape of a distribution, or why kurtosis is relevant to

1 2 3