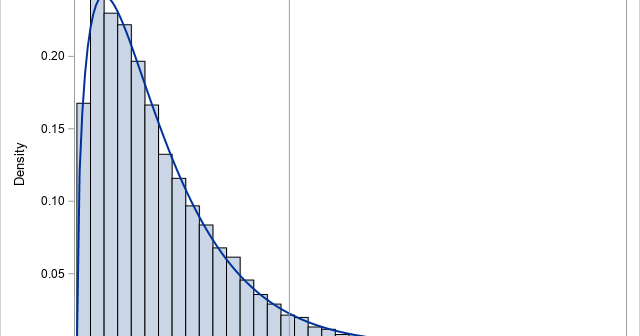
Recently, I wrote about Bartlett's test for sphericity. The purpose of this hypothesis test is to determine whether the variables in the data are uncorrelated. It works by testing whether the sample correlation matrix is close to the identity matrix. Often statistics textbooks or articles include a statement such as


