When I was writing Simulating Data with SAS (Wicklin, 2013), I read a lot of introductory textbooks about Monte Carlo simulation. One of my favorites is Sheldon Ross's book Simulation. (I read the 4th Edition (2006); the 5th Edition was published in 2013.) I love that the book brings together many examples of short, easy-to-understand, applications of using Monte Carlo methods. Over the years, I have blogged about many of these applications, such as estimating π or e by using simulation in SAS.
These examples use random uniform variates to estimate a probability or an area, so they are understandable by anyone who is getting started with Monte Carlo simulation. This article compiles these elementary examples in one location. Each section briefly describes the problem and provides a link to an article that shows how to solve the problem in SAS.
- Estimate π as an area
- Estimate the area of any planar figure
- Buffon's needle: Estimate π from a probability
- Estimate e from a probability
- Estimate a one-dimensional integral or higher-dimensional integrals
- The birthday-matching problem
- The Monty-Hall problem
- The drunkard's walk in one dimension or in two dimensions
Estimate π
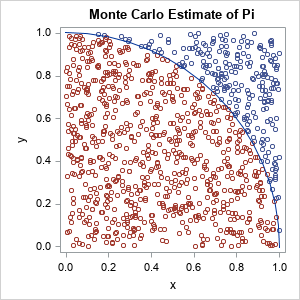
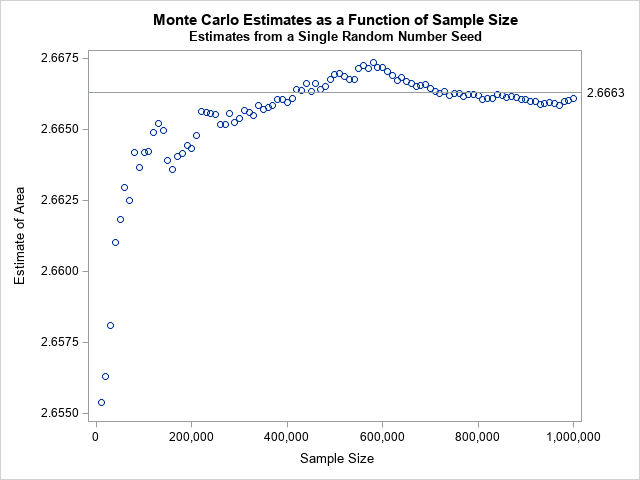
There are multiple ways to formulate the problem of estimating π ≈ 3.14159.... The most famous one is called the "area method." You generate a large number of points uniformly at random in the unit square and count how many are also in the quarter circle Q = {(x,y) | x2 + y2 < 1, x ≥ 0, y ≥ 0}. The graph to the right illustrates this method. The area of the quarter-circle is estimated by the ratio NC / NS, where NC is the number of points inside the quarter circle and NS is the number of points inside the unit square. Because we know that the quarter-circle has area π / 4, an estimate for π is π ≈ 4 NC / NS. Read more about estimating π as an area.
Estimate the area of a planar figure
The Monte Carlo method can be used to estimate the area of any bounded planar figure. You merely need a bounding box and a way to assess whether a random point is inside the figure. Read more about estimating areas by using Monte Carlo techniques.
Buffon's needle problem
One of the many methods for estimating π was introduced by a minor French nobleman, G.-L. Leclerc, the Comte de Buffon (the Count of Buffon). According to legend, the Count dropped a stack of needles on a hardwood floor that had strips of wood aligned in parallel. He noticed that some needles crossed the cracks between boards whereas others dd not. He then formulated one of the first problems in geometric probability: What is the probability that a random needle crosses a line? The general answer depends on the relative width of the lines and the lengths of needles, but if the length of the needle equals the width between boards, the probability is 2 / π. By simulating this experiment, you can estimate π. Read more about Monte Carlo simulation of Buffon's needle.
This problem is also connected to an early example of academic dishonesty. In 1901, Mario Lazzarini claims to have tossed a needle 3,408 times and obtained an estimate of π that is accurate to six decimal places. He almost surely lied about doing the experiment, but his fraud reminds us to critically review claims that seem too good to be true. It is easy to use a simulation to lie and deceive.
Estimate e
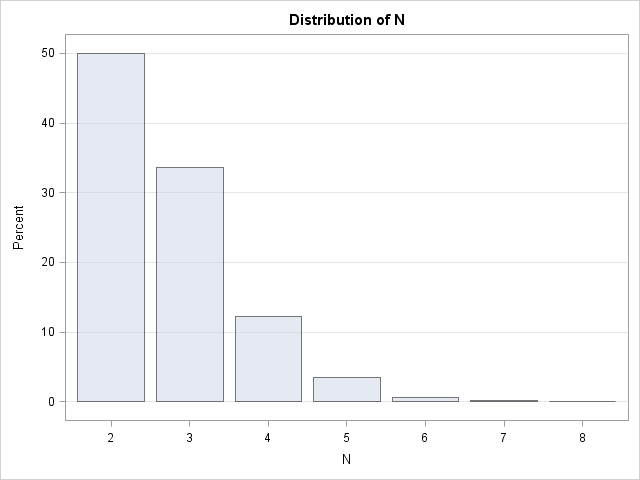
If a computation involves a circle, it is not surprising if π appears in the answer. However, it is less common to see the base of the natural logarithm, e ≈ 2.71828..., appear in a computation. Nevertheless, e is the answer to a very simple problem. Let N be the minimum number of draws from a uniform distribution such that the sum of the variates exceeds 1. What is the expected value of N? We know the answer is greater than 1 and intuition suggests that the answer is greater than 2. With some math and geometry, you can determine that the expected number of variates is e. A Monte Carlo simulation is easy to program by using the SAS DATA step in about 10 lines of code. Read more about how to estimate e by using a probability.
Estimate a one-dimensional integral
Using the Monte Carlo method to estimate an integral is an eye-opening experience.
To estimate the integral of a continuous function g on the interval (a,b), you can generate a uniform random sample in (a,b), evaluate g on each point in the sample, and take the arithmetic mean of those values. In symbols,
\(\int_{a}^{b} g(x) \,dx \approx (b - a) \cdot \frac{1}{n} \sum\nolimits_{i = 1}^{n} g(x_{i})\)
where the \(x_i\) are independent random uniform variates on (a,b).
Read more about Monte Carlo estimates of a one-dimensional integral.
Estimate a higher-dimensional integral
There are many numerical methods for solving one-dimensional integrals. There are few methods for solving high-dimensional integrals. For a rectangular domain, the Monte Carlo method is amazingly simple to implement. For a non-rectangular domain, the method is more complex but still simpler than many competing methods that are taught in multivariate calculus courses. Read more about Monte Carlo estimates of a two-dimensional integral.
The birthday-matching problem
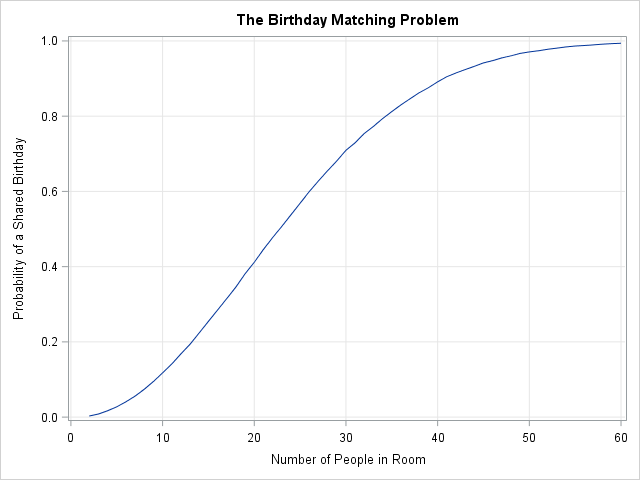
The famous birthday-matching problem (sometimes called the birthday paradox) states that in a room that contains N people, the probability that two people share a birthday is much higher than intuition suggests. In a room of N=23 people, the probability that two people share a birthday is more than 56%. For N=30, the probability is more than 70%. Many people do not believe the result until they write a simulation that demonstrates it is true. Read more about the birthday-matching problem.
The Monty Hall problem
Monty Hall was a game-show host. The Monty Hall problem is a question about conditional probability whose answer is counter-intuitive. Suppose you're on a game show, and you're given the choice of three doors: Behind one door is a car; behind the others, goats. You pick a door, say No. 1, and the host [Monty Hall], who knows what's behind the doors, opens another door, say No. 3, which has a goat. He then says to you, "Do you want to pick door No. 2?" Is it to your advantage to switch your choice? (A goat was a funny way to show that the contestant did not win a prize.)
Many people argue that either you picked the door that contains the prize, or you didn't, so it doesn't make any sense to switch. However, it turns out that if you switch, the probability of winning is 2/3, whereas if you do not switch the probability of winning is 1/3. So, it pays to change your mind! Read more about the Monty-Hall problem.
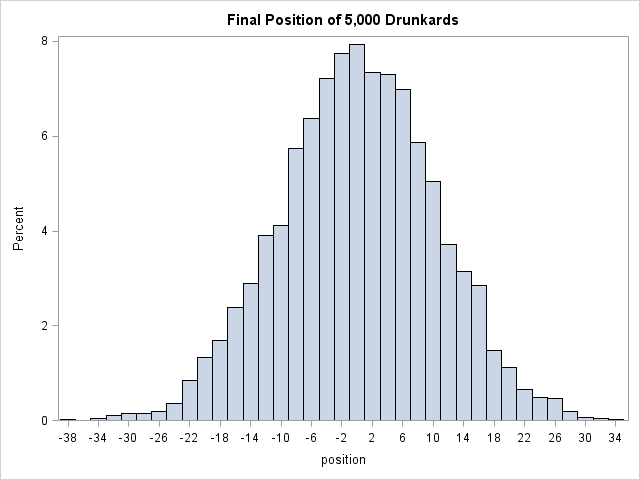
The drunkard's walk
The drunkard's walk is one kind of random walk. The problem asks for the probability that a drunkard (who takes a unit step in a random coordinate direction) returns to his starting location after N steps. However, the same computation can be used to estimate the probability that he ends up at any other location on a unit grid. You can read about how to simulate the drunkard's walk in one dimension, or generalize the problem to simulate a drunkard's walk in two dimensions.
Summary
This article presents several classic examples that use Monte Carlo simulation to estimate an area or a probability. The examples are easy to follow because they simulate from uniform distributions and do not require any advanced knowledge of probability or statistics. As such, these problems are ideal for someone who wants to begin learning how to perform Monte Carlo simulations in SAS. This article collects these examples in one convenient location.

2 Comments
Thank you for publishing Simulating Data with SAS. It has been very useful for my own understanding. I've also been able to use some of your ideas to help my undergraduate students.
Pingback: Estimate pi by tossing coins - The DO Loop