I was recently flipping through Ross' Simulation (2006, 4th Edition) and saw the following exercise: Let N be the minimum number of draws from a uniform distribution [until the sum of the variates]exceeds 1. What is the expected value of N? Write a simulation to estimate the expected value. For
Tag: Statistical Programming
Sometimes it is useful to group observations based on the values of some variable. Common schemes for grouping include binning and using quantiles. In the binning approach, a variable is divided into k equal intervals, called bins, and each observation is assigned to a bin. In this scheme, the size
If you use a word three times, it's yours. -Unknown When I was a child, my mother used to encourage me to increase my vocabulary by saying, "If you use a word three times, it's yours for life." I believe that the same saying holds for programming techniques: Use a
Ah! The joys of sets! It is easy to test whether two vectors are equal in SAS/IML software. It is only slightly more challenging to test whether two sets are equal. Recall that A and B are equal as sets if they contain the same elements. Order does not matter.
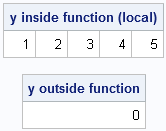
The SAS/IML language supports user-defined functions (also called modules). Many SAS/IML programmers know that you can use the RETURN function to return a value from a user-defined function. For example, the following function returns the sum of each column of matrix: proc iml; start ColSum(M); return( M[+, ] ); /*
It is common to want to extract the lower or upper triangular elements of a matrix. For example, if you have a correlation matrix, the lower triangular elements are the nontrivial correlations between variables in your data. As I've written before, you can use the VECH function to extract the
When you are working with probability distributions (normal, Poisson, exponential, and so forth), there are four essential functions that a statistical programmer needs. As I've written before, for common univariate distributions, SAS provides the following functions: the PDF function, which returns the probability density at a given point the CDF
Suppose that you have two data vectors, x and y, with the same number of elements. How can you rearrange the values of y so that they have the same relative order as the values of x? In other words, find a permutation, π, of the elements of y so
I've been working on a new book about Simulating Data with SAS. In researching the chapter on simulation of multivariate data, I've noticed that the probability density function (PDF) of multivariate distributions is often specified in a matrix form. Consequently, the multivariate density can usually be computed by using the
I often use the SAS/IML language for simulating data with certain known properties. In fact, I'm writing a book called Simulating Data with SAS. When I simulate repeated measurements (sometimes called replicated data), I often want to generate an ID variable that identifies which measurement is associated with which subject