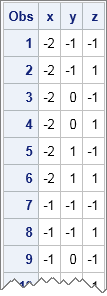
I've written several articles that show how to generate permutations in SAS. In the SAS DATA step, you can use the ALLPEM subroutine to generate all permutations of a DATA step array that contain a small number (18 or fewer) elements. In addition, the PLAN procedure enables you to generate
Tag: Statistical Programming
The truncated normal distribution TN(μ, σ, a, b) is the distribution of a normal random variable with mean μ and standard deviation σ that is truncated on the interval [a, b]. I previously blogged about how to implement the truncated normal distribution in SAS. A friend wanted to simulate data
How do you count the number of unique rows in a matrix? The simplest algorithm is to sort the data and then iterate down the rows, comparing each row with the previous row. However, this algorithm has two shortcomings: it physically sorts the data (which means that the original locations
Last week I showed how to use simulation to estimate the power of a statistical test. I used the two-sample t test to illustrate the technique. In my example, the difference between the means of two groups was 1.2, and the simulation estimated a probability of 0.72 that the t
The power of a statistical test measures the test's ability to detect a specific alternate hypothesis. For example, educational researchers might want to compare the mean scores of boys and girls on a standardized test. They plan to use the well-known two-sample t test. The null hypothesis is that the
The TV show Cheers was set in a bar "where everybody knows your name." Global knowledge of a name is appealing for a neighborhood pub, but not for a programming language. Most programming languages enable you to define functions that have local variables: variables whose names are known only inside
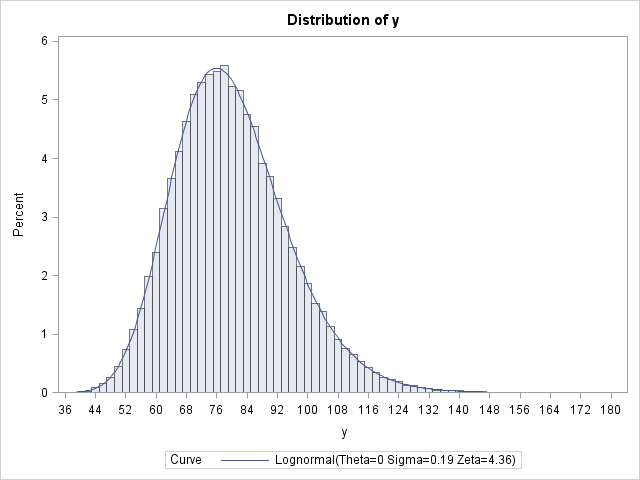
I've previously described how to overlay two or more density curves on a single plot. I've also written about how to use PROC SGPLOT to overlay custom curves on a graph. This article describes how to overlay a density curve on a histogram. For common distributions, you can overlay a
ODS statements are global SAS statements. As such, you can put them anywhere in your SAS program. For maximum readability, many SAS programmers agree that most ODS statements should appear outside procedures in "open" SAS code. For example, most programmers agree that the following statements should appear outside of procedures:
In statistics, distances between observations are used to form clusters, to identify outliers, and to estimate distributions. Distances are used in spatial statistics and in other application areas. There are many ways to define the distance between observations. I have previously written an article that explains Mahalanobis distance, which is
Someone recently asked a question on the SAS Support Communities about estimating parameters in ridge regression. I answered the question by pointing to a matrix formula in the SAS documentation. One of the advantages of the SAS/IML language is that you can implement matrix formulas in a natural way. The