Because the SAS/IML language is a general purpose programming language, it doesn't have a BY statement like most other SAS procedures (such as PROC REG). However, there are several ways to loop over categorical variables and perform an analysis on the observations in each category. One way is to use
Tag: Statistical Programming
Last week I discussed how to fit a Poisson distribution to data. The technique, which involves using the GENMOD procedure, produces a table of some goodness-of-fit statistics, but I find it useful to also produce a graph that indicates the goodness of fit. For continuous distributions, the quantile-quantile (Q-Q) plot
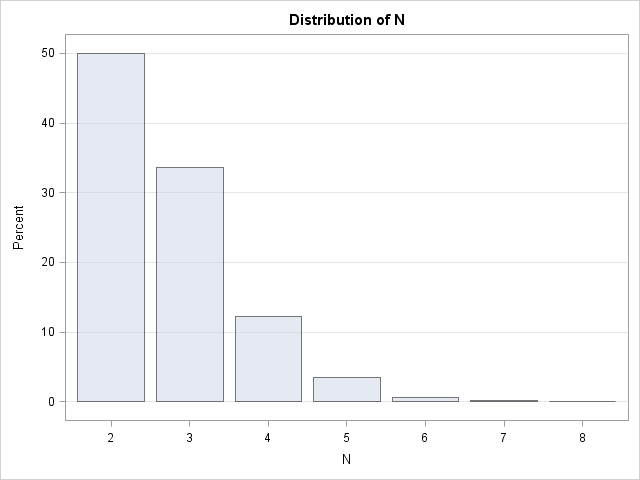
The birthday matching problem is a classic problem in probability theory. The part of it that people tend to remember is that in a room of 23 people, there is greater than 50% chance that two people in the room share a birthday. But the birthday matching problem is also
Over at the SAS Discussion Forums, someone asked how to use SAS to fit a Poisson distribution to data. The questioner asked how to fit the distribution but also how to overlay the fitted density on the data and to create a quantile-quantile (Q-Q) plot. The questioner mentioned that the
Locating missing values is important in statistical data analysis. I've previously written about how to count the number of missing values for each variable in a data set. In Base SAS, I showed how to use the MEANS or FREQ procedures to count missing values. In the SAS/IML language, I
The fundamental units in the SAS/IML language are matrices and vectors. Consequently, you might wonder about conditional expression such as if v>0 then.... What does this expression mean when v contains more than a single element? Evaluating vector expressions When you test a vector for some condition, expressions like v>0
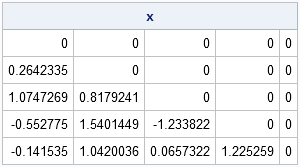
Covariance, correlation, and distance matrices are a few examples of symmetric matrices that are frequently encountered in statistics. When you create a symmetric matrix, you only need to specify the lower triangular portion of the matrix. The VECH and SQRVECH functions, which were introduced in SAS/IML 9.3, are two functions
The SAS/IML language supports both row vectors and column vectors. This is useful for performing linear algebra, but it can cause headaches when you are writing a SAS/IML module. I want my modules to be able to handle both row vectors and column vectors. I don't want the user to
A recent discussion on the SAS-L discussion forum concerned how to implement linear interpolation in SAS. Some people suggested using PROC EXPAND in SAS/ETS software, whereas others proposed a DATA step solution. For me, the SAS/IML language provides a natural programming environment to implement an interpolation scheme. It also provides
Most statistical programmers have seen a graph of a normal distribution that approximates a binomial distribution. The figure is often accompanied by a statement that gives guidelines for when the approximation is valid. For example, if the binomial distribution describes an experiment with n trials and the probability of success