Tag: Data Analysis

Rick Wicklin 1
Compute sample quantiles by using the QNTL call

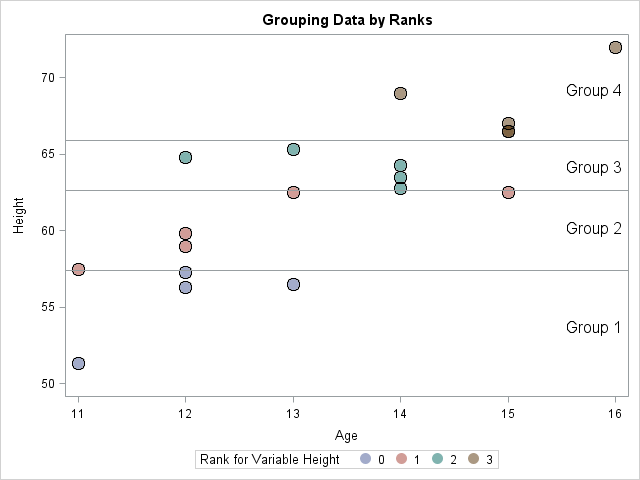
SAS provides several ways to compute sample quantiles of data. The UNIVARIATE procedure can compute quantiles (also called percentiles), but you can also compute them in the SAS/IML language. Prior to SAS/IML 9.22 (released in 2010) statistical programmers could call a SAS/IML module that computes sample quantiles. With the release

Rick Wicklin 3
Quantiles of discrete distributions

I work with continuous distributions more often than with discrete distributions. Consequently, I am used to thinking of the quantile function as being an inverse cumulative distribution function (CDF). (These functions are described in my article, "Four essential functions for statistical programmers.") For discrete distributions, they are not. To quote

Rick Wicklin 17
Testing data for multivariate normality

I've blogged several times about multivariate normality, including how to generate random values from a multivariate normal distribution. But given a set of multivariate data, how can you determine if it is likely to have come from a multivariate normal distribution? The answer, of course, is to run a goodness-of-fit

Advanced Analytics
Rick Wicklin 101
What is Mahalanobis distance?

I previously described how to use Mahalanobis distance to find outliers in multivariate data. This article takes a closer look at Mahalanobis distance. A subsequent article will describe how you can compute Mahalanobis distance. Distance in standard units In statistics, we sometimes measure "nearness" or "farness" in terms of the

Rick Wicklin 5
Detecting outliers in SAS: Part 2: Estimating scale

In a previous blog post on robust estimation of location, I worked through some of the examples in the survey article, "Robust statistics for outlier detection," by Peter Rousseeuw and Mia Hubert. I showed that SAS/IML software and PROC UNIVARIATE both support the robust estimators of location that are mentioned

Rick Wicklin 3
Overlay density estimates on a plot

A recent question on a SAS Discussion Forum was "how can you overlay multiple kernel density estimates on a single plot?" There are three ways to do this, depending on your goals and objectives. Overlay different estimates of the same variable Sometimes you have a single variable and want to