Tag: Data Analysis

Rick Wicklin 17
Testing data for multivariate normality

I've blogged several times about multivariate normality, including how to generate random values from a multivariate normal distribution. But given a set of multivariate data, how can you determine if it is likely to have come from a multivariate normal distribution? The answer, of course, is to run a goodness-of-fit

Advanced Analytics
Rick Wicklin 101
What is Mahalanobis distance?

I previously described how to use Mahalanobis distance to find outliers in multivariate data. This article takes a closer look at Mahalanobis distance. A subsequent article will describe how you can compute Mahalanobis distance. Distance in standard units In statistics, we sometimes measure "nearness" or "farness" in terms of the

Rick Wicklin 5
Detecting outliers in SAS: Part 2: Estimating scale

In a previous blog post on robust estimation of location, I worked through some of the examples in the survey article, "Robust statistics for outlier detection," by Peter Rousseeuw and Mia Hubert. I showed that SAS/IML software and PROC UNIVARIATE both support the robust estimators of location that are mentioned

Rick Wicklin 3
Overlay density estimates on a plot

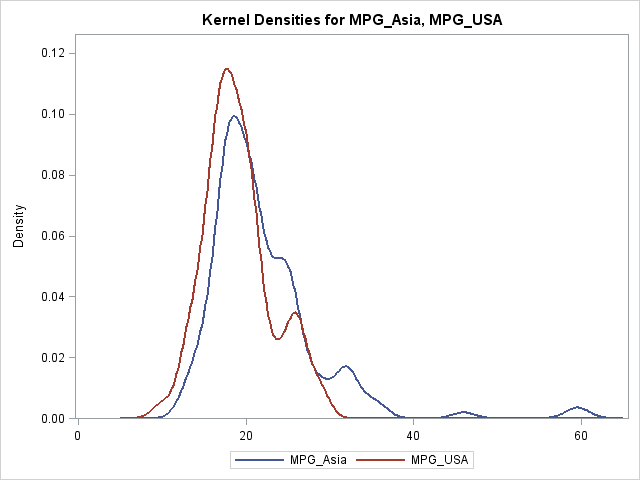
A recent question on a SAS Discussion Forum was "how can you overlay multiple kernel density estimates on a single plot?" There are three ways to do this, depending on your goals and objectives. Overlay different estimates of the same variable Sometimes you have a single variable and want to

1 38 39 40 41 42 47