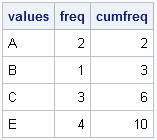
A reader asked: I want to create a vector as follows. Suppose there are two given vectors x=[A B C] and f=[1 2 3]. Here f indicates the frequency vector. I hope to generate a vector c=[A B B C C C]. I am trying to use the REPEAT function

A reader asked: I want to create a vector as follows. Suppose there are two given vectors x=[A B C] and f=[1 2 3]. Here f indicates the frequency vector. I hope to generate a vector c=[A B B C C C]. I am trying to use the REPEAT function
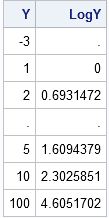
SAS software provides many run-time functions that you can call from your SAS/IML or DATA step programs. The SAS/IML language has several hundred built-in statistical functions, and Base SAS software contains hundreds more. However, it is common for statistical programmers to extend the run-time library to include special user-defined functions.
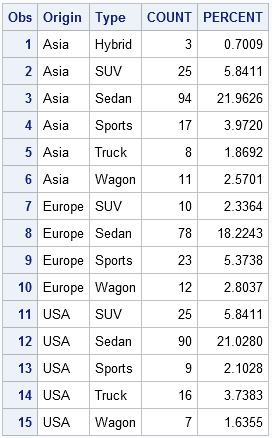
Because the SAS/IML language is a general purpose programming language, it doesn't have a BY statement like most other SAS procedures (such as PROC REG). However, there are several ways to loop over categorical variables and perform an analysis on the observations in each category. One way is to use
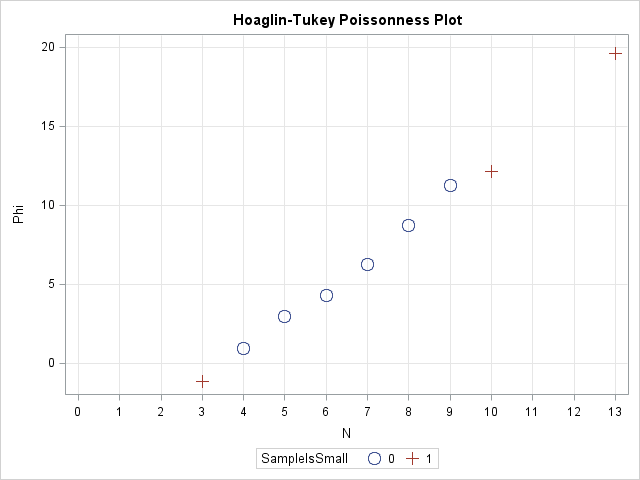
Last week I discussed how to fit a Poisson distribution to data. The technique, which involves using the GENMOD procedure, produces a table of some goodness-of-fit statistics, but I find it useful to also produce a graph that indicates the goodness of fit. For continuous distributions, the quantile-quantile (Q-Q) plot
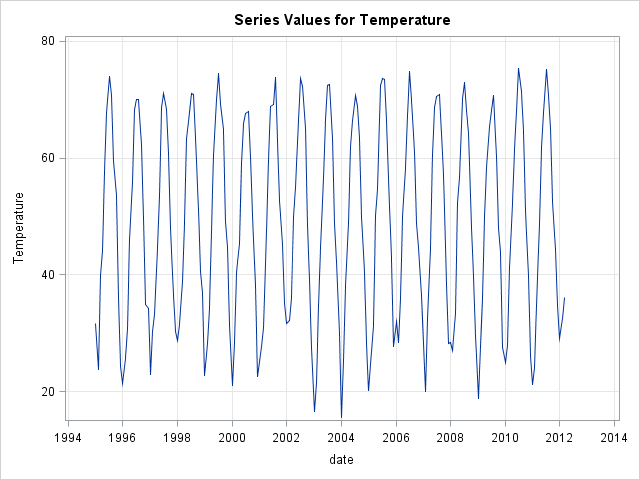
Last week I blogged about how to construct a smoother for a time series for the temperature in Albany, NY from 1995 to March, 2012. I smoothed the data by "folding" the time series into a single "year" that contains repeated measurements for each day of the year. Experts in
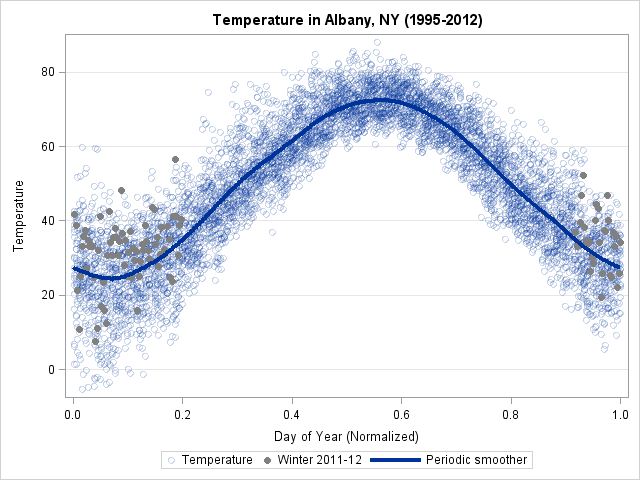
In yesterday's post, I discussed a "quick and dirty" method to smooth periodic data. However, after I smoothed the data I remarked that the smoother itself was not exactly periodic. At the end points of the periodic interval, the smoother did not have equal slopes and the method does not
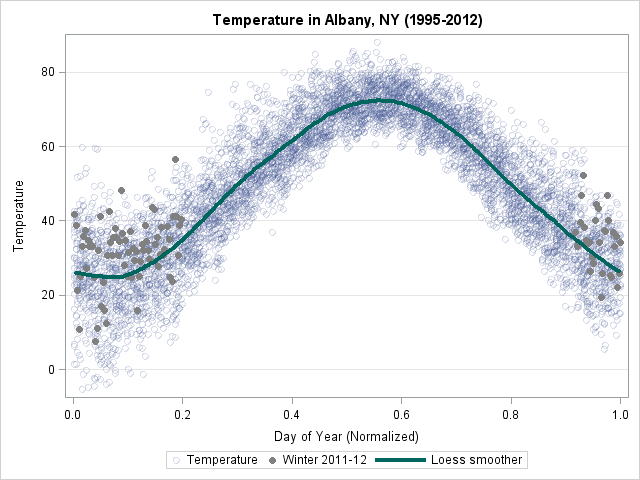
Over at the SAS and R blog, Ken Kleinman discussed using polar coordinates to plot time series data for multiple years. The time series plot was reproduced in SAS by my colleague Robert Allison. The idea of plotting periodic data on a circle is not new. In fact it goes
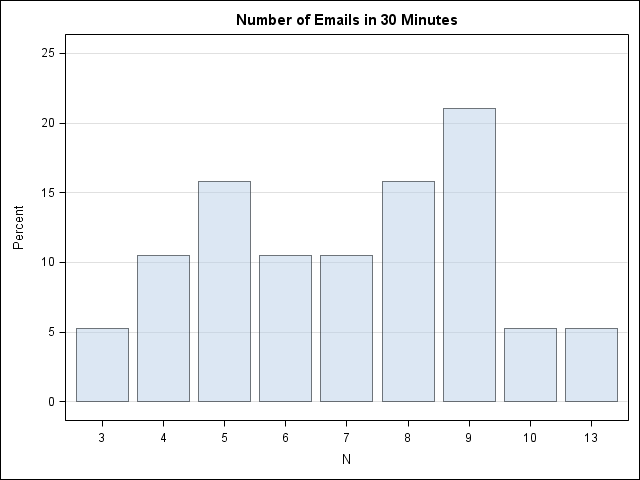
Over at the SAS Discussion Forums, someone asked how to use SAS to fit a Poisson distribution to data. The questioner asked how to fit the distribution but also how to overlay the fitted density on the data and to create a quantile-quantile (Q-Q) plot. The questioner mentioned that the
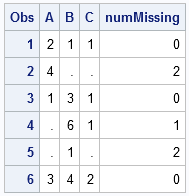
Locating missing values is important in statistical data analysis. I've previously written about how to count the number of missing values for each variable in a data set. In Base SAS, I showed how to use the MEANS or FREQ procedures to count missing values. In the SAS/IML language, I
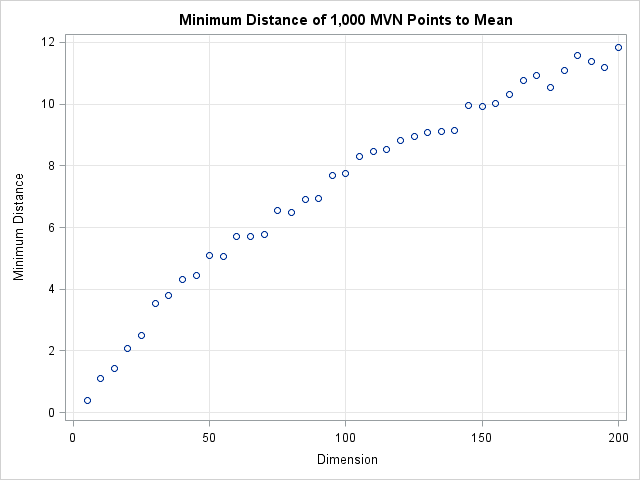
After my post on detecting outliers in multivariate data in SAS by using the MCD method, Peter Flom commented "when there are a bunch of dimensions, every data point is an outlier" and remarked on the curse of dimensionality. What he meant is that most points in a high-dimensional cloud