English

Rick Wicklin 3
Overlay plots on a box plot in SAS: Discrete X axis

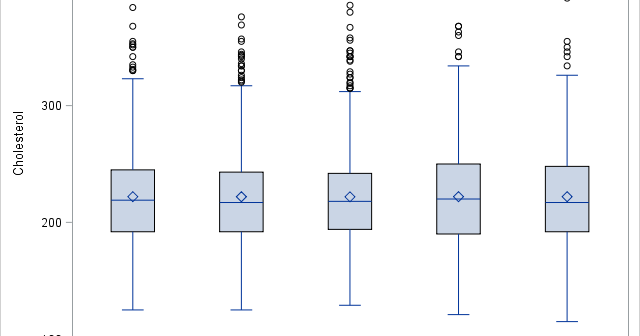
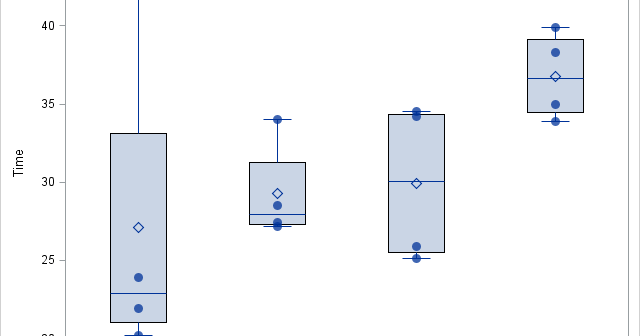
Box plots summarize the distribution of a continuous variable. You can display multiple box plots in a single graph by specifying a categorical variable. The resulting graph shows the distribution of subpopulations, such as different experimental groups. In the SGPLOT procedure, you can use the CATEGORY= option on the VBOX

Rick Wicklin 7
Create spaghetti plots in SAS

What is a spaghetti plot? Spaghetti plots are line plots that involve many overlapping lines. Like spaghetti on your plate, they can be hard to unravel, yet for many analysts they are a delicious staple of data visualization. This article presents the good, the bad, and the messy about spaghetti

Learn SAS
Rick Wicklin 0
Grids and linear subspaces

A grid is a set of evenly spaced points. You can use SAS to create a grid of points on an interval, in a rectangular region in the plane, or even in higher-dimensional regions like the parallelepiped shown at the left, which is generated by three vectors. You can use

Rick Wicklin 13
Compute the square root matrix

Children in primary school learn that every positive number has a real square root. The number x is a square root of s, if x2 = s. Did you know that matrices can also have square roots? For certain matrices S, you can find another matrix X such that X*X

Learn SAS
Rick Wicklin 6
Create a package in SAS/IML

In a previous post I showed how to download, install, and use packages in SAS/IML 14.1. SAS/IML packages incorporate source files, documentation, data sets, and sample programs into a ZIP file. The PACKAGE statement enables you to install, uninstall, and manage packages. You can load functions and data into your

1 76 77 78 79 80 149