Descriptive univariate statistics are the foundation of data analysis. Before you create a statistical model for new data, you should examine descriptive univariate statistics such as the mean, standard deviation, quantiles, and the number of nonmissing observations.
In SAS, there is an easy way to create a data set that contains the descriptive statistics for every numerical variable in your data: use the OUTTABLE= option in PROC UNIVARIATE. It doesn't matter if your data has 5 variables or 5,000 variables. That one option writes dozens of statistics for all numerical variables in the data!
PROC MEANS: A great way to display statistics on the screen
First, some basic background about viewing descriptive statistics. Many people learned that PROC MEANS is the standard way to display descriptive statistics on your computer screen. You specify the statistics that you want on the PROC MEANS statement, as follows:
/* can produce 38 descriptive statistics */ proc means data=sashelp.cars nolabels N Mean Std Min Q1 Median Q3 Max; /* specify the statistics */ run; /* omit VAR statement to analyze all numerical variables */ |
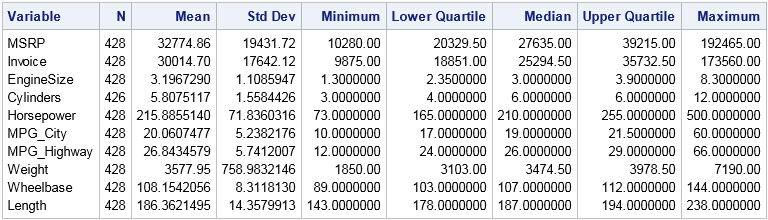
Notice that by omitting the VAR statement, the procedure analyzes all numerical variables. The output is an ODS table named "Summary."
That was easy. However, suppose that you do not care about seeing the statistics on your computer monitor, but you want them written to a SAS data set. Because you are analyzing many variables and want many statistics, it is somewhat awkward to use the OUTPUT statement in PROC MEANS. An easier way is to use ODS to write the statistics to a data set by doing the following:
- Use the ODS EXCLUDE statement to suppress output to the monitor.
- Specify the statistics that you want to see: the mean, standard deviation, median, and so forth.
- Specify the STACKODSOUTPUT option on the PROC MEANS statement to tell the procedure to preserve the tabular form of the statistics table.
- Use the ODS OUTPUT statement to write the "Summary" table to a SAS data set.
The solution now requires several lines of typing. It's not onerous, but it is a lot to remember:
ods exclude all; /* suppress display to open ODS destinations */ proc means data=sashelp.cars N Mean Std Min Q1 MEDIAN Q3 Max /* type every statistic you want */ STACKODSOUTPUT; /* preserve table form of output */ ods output Summary=MeansSummary; /* write statistics to data set */ run; ods exclude none; /* restore normal display of tables */ |
The data set MeansSummary contains the statistics for every numerical variable in the original data. This solution requires using ODS statements to direct the output to a data set while suppressing it from appearing on the screen. It is a nice trick in general, but there is an easier way for this particular task.
PROC UNIVARIATE and the OUTTABLE= option
I've been using SAS for 20 years, but somehow I never learned about the OUTTABLE= option in PROC UNIVARIATE until last week. While reading the documentation I learned that the OUTTABLE= option creates an output data set that contains 46 descriptive statistics for each numerical variable on the VAR statement.
Cool #SAS option: easily write all descriptive #statistics to a data set Share on XIf you omit the VAR statement, PROC UNIVARIATE analyzes all numerical variables. Therefore, by specifying the OUTTABLE= option, you can duplicate the PROC MEANS example without using ODS. As an extra bonus, you do not have to type the names of any statistics.
The following statement computes 46 statistics for each numerical variable in the input data set. The data set UniSummary contains the results. The NORMAL option tells PROC UNIVARIATE to include the Kolmogorov-Smirnov test for normality in the statistics that it creates:
proc univariate data=sashelp.cars outtable=UniSummary NORMAL noprint; run; /* omit VAR statement to analyze all numerical variables */ proc contents data=UniSummary short; run; |
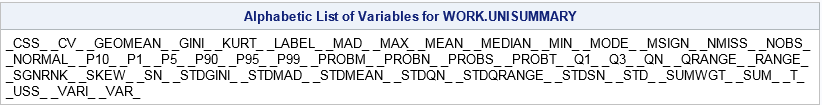
By default, PROC UNIVARIATE produces about two pages of tables for each numerical variable, but the NOPRINT option suppresses the display of tables. The output from PROC CONTENTS shows the names of variables in the output data set. Each name represents a statistic, such as CSS (cumulative sum of squares), CV (coefficient of variation), and GEOMEAN (geometric mean). The names begin and end with an underscore. The following statements print the same summary statistics that PROC MEANS produced; the output is not shown.
proc print data=UniSummary label; var _var_ _label_ _NObs_ _Mean_ _Std_ _Min_ _Max_; run; |
For both procedures, you can use the CLASS statement to obtain statistics for subgroups of the data. For example, you can include the statement CLASS origin to obtain summary statistics for each variable and grouped according to whether a vehicle was manufactured in Europe, Asia, or the USA.
It is worth noting that PROC UNIVARIATE has options (for example, WINSORIZED= and TRIMMED=) that compute statistics that are not saved to the OUTTABLE= data set. However, you can use ODS to capture those statistics.
In summary, this article shows how to create a data set for descriptive statistics by using PROC MEANS or PROC UNIVARIATE. You can use either procedure, but using the OUTTABLE= option in PROC UNIVARIATE saves you some typing. The OUTTABLE= data set also includes some robust statistics that are not available in PROC MEANS.

4 Comments
Wow, I really love this blog post!! Such as simple option OUTTABLE= that can produce so much useful info useful before model building. And, it's great that it can be paired with CLASS statement for subgroups too.
Only slight issue is that if the input dataset has no variable labels then _LABEL_ column is not present in the OUTTABLE= dataset but really minor issue.
But why, oh why, SAS can you not do this easily with a table that contains both numeric and categorical data? Why can't I use proc freq on large datasets? (It's because it needs to transpose the data behind the scenes and quickly hits a limit)
Summary descriptive stats remain a huge pain using SAS.
Thanks for writing. PROC FREQ is used for statistical analysis of categorical data. If all you want is counts and summaries, SAS supports several Base SAS procedures that are multithreaded. There are also SAS procedures that work in-database and there are SAS procedures that can perform distributed parallel processing on massive grids.
Perhaps your problem is that you are trying to perform a frequency analysis on a continuous (interval) variable. PROC FREQ does not transpose the data, but it does build trees of the unique values in variables, which can be time-consuming and memory-intensive when there are many unique values. Fortunately, SAS can help you determine whether to treat a numeric variable as continuous (many levels) or as discrete (relatively few levels). You can then get frequency tables for the categorical variables and means/StdDev for the continuous variables.
Since you seem to be experiencing difficulties, I encourage you to use the SAS Support Communities. There are many experts who have lots of experience using SAS on data that have billions of records. If you describe the pains you are having, they can almost surely recommend some best practices that will ease your pain.
Understanding the characteristics of your data is important before embarking on any analysis task. I can offer this technique to report on the "cardinality" -- or numbers of unique values -- among the variables in your data set. It does use PROC FREQ and the NLEVELS option to do its work.