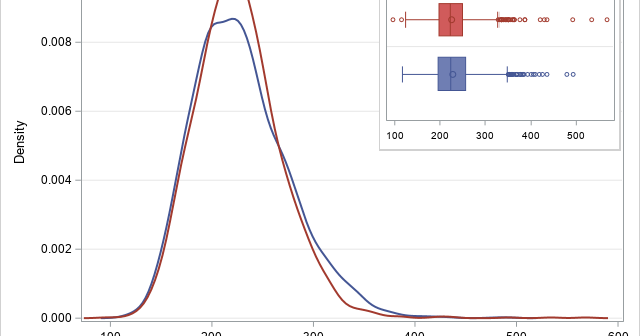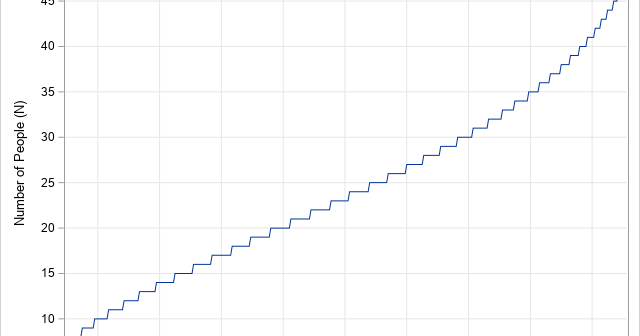
The metalog family of distributions (Keelin, Decision Analysis, 2016) is a flexible family that can model a wide range of continuous univariate data distributions when the data-generating mechanism is unknown. This article provides an overview of the metalog distributions. A subsequent article shows how to download and use a library
Author
A SAS programmer asked for help to simulate data from a distribution that has certain properties. The distribution must be supported on the interval [a, b] and have a specified mean, μ, where a < μ < b. It turns out that there are infinitely many distributions that satisfy these
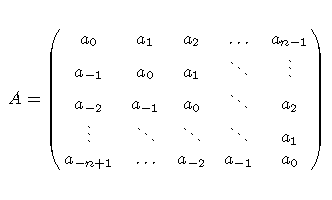
You can use a Markov transition matrix to model the transition of an entity between a set of discrete states. A transition matrix is also called a stochastic matrix. A previous article describes how to use transition matrices for stochastic modeling. You can estimate a Markov transition matrix by using
SAS programmers love to make special graphs for Valentine's Day. In fact, there is a long history of heart-shaped graphs and love-inspired programs written in SAS! Last year, I added to the collection by showing how a ball bounces on a heart-shaped billiards table. This year, I create a similar
This article is about how to use Git to share SAS programs, specifically how to share libraries of SAS IML functions. Some IML programmers might remember an earlier way to share libraries of functions: SAS/IML released "packages" in SAS 9.4m3 (2015), which enable you to create, document, share, and use
SAS supports the ColorBrewer system of color palettes from the ColorBrewer website (Brewer and Harrower, 2002). The ColorBrewer color ramps are available in SAS by using the PALETTE function in SAS IML software. The PALETTE function supports all ColorBrewer palettes, but some palettes are not interpretable by people with color
Did you know that about 8% of the world's men are colorblind? (More correctly, 8% of men are "color vision deficient," since they see colors, but not all colors.) Because of the "birthday paradox," in a room that contains eight men, the probability is 50% that at least one is
I previously discussed how to use the PUTLOG statement to write a message from the DATA step to the log in SAS. The PUTLOG statement is commonly used to write notes, warnings, and errors to the log. This article shows how to use the PRINTTOLOG subroutine in SAS IML software
Many experienced SAS programmers use the PUT statement to write messages to the log from a DATA step. But did you know that SAS supports the PUTLOG function, which is another way to write a message to the log? I use the PUTLOG statement in the DATA step for the
A previous article shows that you can use the Intercept parameter to control the ratio of events to nonevents in a simulation of data from a logistic regression model. If you decrease the intercept parameter, the probability of the event decreases; if you increase the intercept parameter, the probability of