Did you know that the loess regression algorithm is not well-defined when you have repeated values among the explanatory variables, and you request a very small smoothing parameter? This is because loess regression at the point x0 is based on using the k nearest neighbors to x0. If x0 has m > k neighbors that are all the same distance from x0, then there is not a unique way to choose a set of k nearest neighbors.
When Cleveland and colleagues developed locally weighted regression (loess), they described the algorithm as "analogous to how a moving average is computed for a time series" (Cleveland and Devlin, JASA, 1988, p. 596). However, the loess algorithm does not require that the data are "measured at equally spaced points in time." Rather, it applies "to the more general case of regression analysis" (p. 596) where the independent variable(s) can be spaced somewhat arbitrarily. However, Cleveland and Devlin (1988) do not discuss the fact that the algorithm is not well-defined when the data have repeated values for the explanatory variable.
This article discusses the issue and a related fact: If the explanatory variable contains repeated values, the predicted values of a loess regression might depend on the order of the data.
Repeated values cause problems in many nonparametric analyses
Repeated (or tied) values can cause problems in nonparametric analyses because many nonparametric analyses use ranks instead of raw data values. I have previously written about how tied values affect rank-based normal scores, which are used in certain nonparametric tests. I have also discussed how binning by quantiles is affected by tied values. In practice, many tied values will affect the results more than a small number of tied values.
Tied values also affect nearest-neighbor algorithms for which you specify the number of neighbors, such as for spatial data analysis and loess regression, to name just two examples. If you ask for the k closest neighbors to x0, what do you do if there are more than k observations that are the same distance away? For univariate data, this can occur when there are more than k repeated values for the explanatory variable.
A simple loess example that has tied values
Let's construct an example that has N=21 observations but only three unique values of the X variable. The following SAS DATA step constructs the example and uses PROC SGPLOT to fit a loess curve through the scatter plot.
data Simple; x= -1; do y = -1 to 1 by 2/9; /* 10 observations for x = -1 */ output; end; x = 0; y = 0; output; x= +1; do y = -1 to 1 by 2/9; /* 10 observations for x = +1 */ output; end; run; title "Default Loess Fit"; title2 "alpha = 0.929; k=19 Neighbors"; proc sgplot data=Simple; loess x=x y=y; run; |
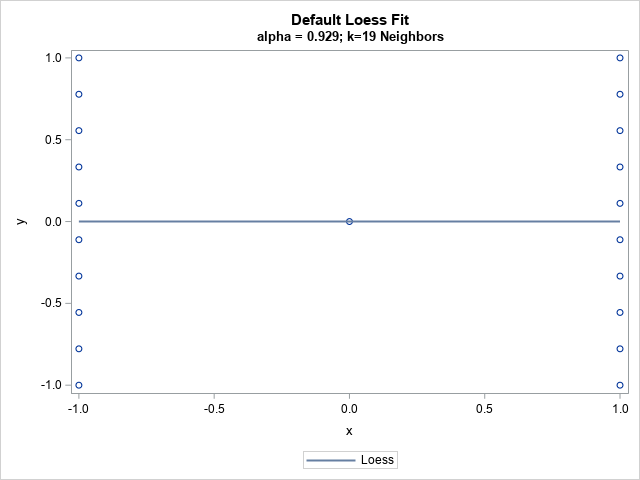
The graph shows the 21 observations and a loess fit. There are 10 observations for which x = -1 and 10 for which x = +1. The loess algorithm searches for a value of the smoothing parameter that minimizes a goodness-of-fit criterion. For these data, the best value of the smoothing parameter is 0.93, which means "use 93% of the observations when you perform local regression estimates." In terms of nearest neighbors, it means "use the nearest 19 observations" to make predictions.
Already you might be wondering which 19 values are used to evaluate the smoother at each value of x. It's not clear, right? The issue becomes more apparent if you manually force the loess algorithm to use a smoothing parameter such as α = 1/3, which tells the algorithm to use 1/3 of the observations (k=7 observations) to make predictions for each value of x. The following call to PROC SGPLOT displays one loess curve that uses k=7 observations and another curve that uses k=4 observations.
title "Data Are Sorted by X and Y"; title2 "Y Ascending"; proc sgplot data=Simple; scatter x=x y=y; loess x=x y=y / smooth=0.34 legendlabel="k=7 nbrs" nomarkers name='L1'; loess x=x y=y / smooth=0.2 legendlabel="k=4 nbrs" nomarkers name='L2'; keylegend 'L1' 'L2' / title="Nearest Neighbors" location=inside position=S across=1; run; |
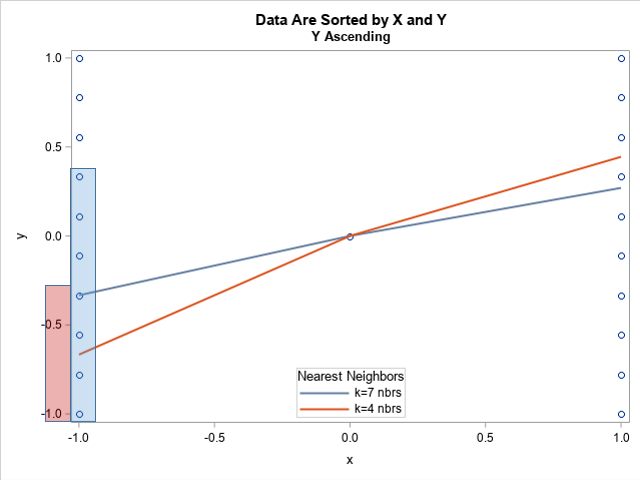
I added a blue rectangle and a red rectangle to the left side of the plot because I want to focus on the predicted value at x = -1. The question is, which seven observations were used to make the prediction at x = -1? It seems clear that the predicted value in blue is the mean of the seven observations that are inside the blue rectangle. Those happen to be the first seven observations in the data set.
Mathematically, the predicted value at x = -1 is not well-defined. The loess algorithm wants to predict the value a x = -1 by using k=7 observations whose x value is nearest to -1. But there are 10 observations whose distance to x = -1 is exactly 0. The loess algorithm can use any of the "10 choose 7" = 120 possible sets of observations that have x = -1. When k=7, the prediction at x = -1 is unique only when there at seven or fewer observations for which x = -1.
The graph shows a similar situation for the smoothing parameter α=0.2, which corresponds to k=4 nearest neighbors. Again, the loess algorithm can choose any set of four observations to estimate the predicted value. For this example, the first four observations in the data set were used, as shown by the light red rectangle on the graph. This is a valid choice, but it is not the only choice.
Warning about this issue
When you use PROC LOESS to fit a loess smoother, the procedure displays a warning in the log to alert you to the fact that the predicted values are not unique:
proc loess data=Simple plots(only)=fitplot; model y=x / smooth=(0.34 0.2) direct; run; |
WARNING: At smoothing parameter 0.34, the local SSCP matrix for
         21 fit point(s) is numerically singular. The fitted
         value and standard errors at those points are not
         uniquely defined.
WARNING: At smoothing parameter 0.2, the local SSCP matrix for
         21 fit point(s) is numerically singular. The fitted
         value and standard errors at those points are not
uniquely defined. |
Notice that the warning from PROC LOESS states that "the fitted value" is "not uniquely defined." The LOESS statement in PROC SGPLOT uses the same algorithm as PROC LOESS but does not display a warning. The loess algorithm in other statistical software might issue an error and refuse to carry out the regression.
A loess prediction might depend on the order of the data
Because the fitted value is not uniquely defined, the fitted value might change if you change the order of the data. The previous graph suggests that the predicted value at x = -1 uses the first k observations in the data set. Let's sort the data in a different order and see if the predicted value changes:
proc sort data=Simple out=YDesc; by x descending y; run; title2 "Y Descending"; proc sgplot data=YDesc; scatter x=x y=y; loess x=x y=y / smooth=0.34 legendlabel="k=7 nbrs" nomarkers name='L1'; loess x=x y=y / smooth=0.2 legendlabel="k=4 nbrs" nomarkers name='L2'; keylegend 'L1' 'L2' / title="Nearest Neighbors" location=inside position=S across=1; run; |
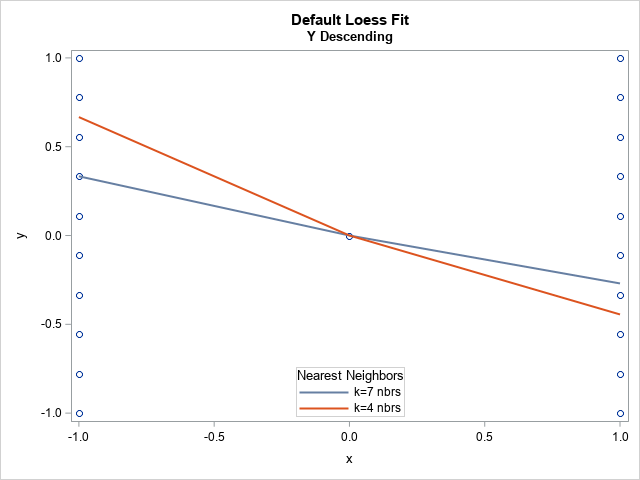
As suspected, the predicted value at x = -1 is different from before. The predicted value is the average of the first k observations, but now the loess algorithm is using a different set of seven observations. This prediction is neither more correct nor more wrong than the earlier predicted value.
What to do if you have repeated values?
I've described a problem, but what can you do about it? The simplest advice is to never use the loess algorithm when the explanatory variable has repeated values. Instead, you can use a spline smoother, such as a penalized B-spline. (PROC SGPLOT supports the PBSPLINE statement for overlaying a penalized B spline.)
If you don't want to avoid the loess algorithm, at least be aware that you will get predicted values that are not unique. Also, realize that the predicted values might depend on the order of the data.
For the example in this article, I intentionally chose data and a small smoothing parameter so that the problem was obvious. If you have only a few repeated values in your data, or if you use larger values of the smoothing parameter, you might not notice the effect of the repeated values.
Every statistical procedure makes certain assumptions about the data. The best way to use a statistical algorithm is to be aware of the assumptions and know what happens if you violate them. For the loess regression algorithm, the algorithm assumes that there are no tied values among the explanatory variables.
Summary
Be cautious when you use the loess algorithm to add a scatter plot smoother. The algorithm is based on ideas from time series analysis and implicitly assumes that there are no repeated values for the explanatory variable. If you have tied values, then the predicted value at certain locations might not be unique and can depend on the order of observations in the data set. The effect is most pronounced when you use a very small value of the smoothing parameter, or the data contain many tied values.
In closing, I'll add that this article discusses the loess algorithm from a mathematical point of view. In practice, implementations such as PROC LOESS in SAS might use computational methods such as interpolation, k-D tree, and blending to improve the computational efficiency of the algorithm. This means that the algorithm does not actually choose the k nearest neighbors directly for each predicted value. However, the general issue that I describe is still relevant, as shown in the artificial example in this article.

2 Comments
Hi Rick, how do you get .929 as the best value of the smoothing parameter? I don't see this in the output, and the default fit statistics in PROC LOESS are identical for smoothing parameters ranging from .5 to 1. They only start dropping with smooth=.47 (9 neighbors). Thanks for any clarification.
Sincerely,
George
For this highly degenerate example, the GCV is flat for alpha >= 0.5. Therefore, the optimal value is not unique and any parameter in [0.5 1] is a valid optimal value.
When ODS GRAPHICS are on, PROC LOESS produces a criterion plot and a table that shows the selected smoothing parameter. To see only these outputs, use
ods select CriterionPlot SmoothingCriterion;
You can see the global shape of the GCV curve as a function of the smoothing parameter by using an option on the MODEL statement:
model y=x / select=GCV(global);