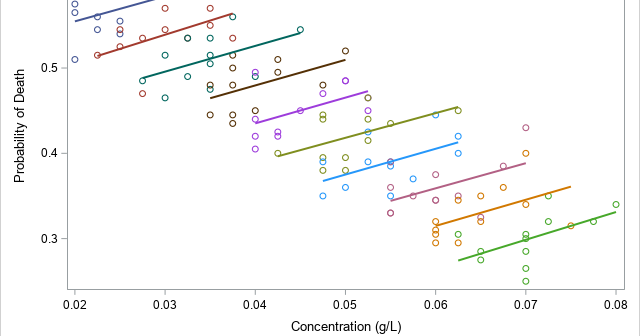
A data analyst wanted to estimate the correlation between two variables, but he was concerned about the influence of a confounding variable that is correlated with them. The correlation might affect the apparent relationship between main two variables in the study. A common confounding variable is age because young people
Tag: SAS Programming
This article is about how to use Git to share SAS programs, specifically how to share libraries of SAS IML functions. Some IML programmers might remember an earlier way to share libraries of functions: SAS/IML released "packages" in SAS 9.4m3 (2015), which enable you to create, document, share, and use
SAS supports the ColorBrewer system of color palettes from the ColorBrewer website (Brewer and Harrower, 2002). The ColorBrewer color ramps are available in SAS by using the PALETTE function in SAS IML software. The PALETTE function supports all ColorBrewer palettes, but some palettes are not interpretable by people with color
Many experienced SAS programmers use the PUT statement to write messages to the log from a DATA step. But did you know that SAS supports the PUTLOG function, which is another way to write a message to the log? I use the PUTLOG statement in the DATA step for the
Every year, I write a special article for Halloween in which I show a SAS programming TRICK that is a real TREAT! This year, the trick is to concatenate two strings into a single string in a way that guarantees you can always recover the original strings. I learned this
Have you ever typed your credit card into an online order form and been told that you entered the wrong number? Perhaps you wondered, "How do they know that the numbers I typed do not make a valid credit card number?" The answer is that credit card numbers and other
The correlations between p variables are usually displayed by using a symmetric p x p matrix of correlations. However, sometimes you might prefer to see the correlations listed in "long form" as a three-column table, as shown to the right. In this table, each row shows a pair of variables and the
John Tukey was an influential statistician who proposed many statistical concepts. In the 1960s and 70s, he was fundamental in the discovery and exposition of robust statistical methods, and he was an ardent proponent of exploratory data analysis (EDA). In his 1977 book, Exploratory Data Analysis, he discussed a small
A SAS programmer asked for help on a discussion forum: "My SAS session will not display any tables or graphs! I try to use PROC PRINT and other procedures, but no output is displayed! What can I do?" The most common reasons why you might not see any output when
I've previously shown how to use Monte Carlo simulation to estimate probabilities and areas. I illustrated the Monte Carlo method by estimating π ≈ 3.14159... by generating points uniformly at random in a unit square and computing the proportion of those points that were inside the unit circle. The previous