The correlations between p variables are usually displayed by using a symmetric p x p matrix of correlations. However, sometimes you might prefer to see the correlations listed in "long form" as a three-column table, as shown to the right. In this table, each row shows a pair of variables and the correlation between them. I call this the "list format."
This article demonstrates two ways to display correlations in a list format by using Base SAS. First, this article shows how to use the FISHER option in PROC CORR to create a table that contains the correlations in a list. Second, this article shows how to use the DATA step to convert the symmetric matrix into a simple three-column table that displays the pairwise statistics between variables. This is useful when you have a matrix of statistics that was produced by a procedure other than PROC CORR.
The FISHER option to create a table of pairwise correlations
If you want to get the correlations between variables in a three-column table (instead of a matrix), use the FISHER option in PROC CORR. The FISHER option is used to produce confidence intervals and p-values for a hypothesis test, but it also presents the statistics in a column. As usual, you can use the ODS OUTPUT statement to save the table to a data set. The following call to PROC CORR analyzes a subset of the Sashelp.Iris data.
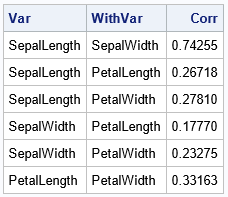
proc corr data=sashelp.iris(where=(Species="Setosa")) FISHER; /* FISHER ==> list of Pearson correlations */ var _numeric_; ods output FisherPearsonCorr = CorrList; /* Optional: Put the correlations in a data set */ run; proc print data=CorrList noobs; var Var WithVar Corr; run; |
The output is shown at the top of this article. Use this trick when you want to output Pearson (or Spearman) correlations in list format.
However, this trick does not work for other correlations (such as Kendall's or Hoeffding's), nor on statistics that are produced by a different procedure. For example, the CORRB option on the MODEL statement in PROC REG produces a matrix of correlations between the regression parameters in the model. It does not provide a special option to display the correlations in a list format. The next section shows how to use the DATA step to convert the statistics from wide form (a symmetric matrix) to long form (the list format).
Generate the correlations between all variables
If you have a symmetric matrix stored in a SAS data set, you can use the DATA step to convert the matrix elements from wide form to long form. This section uses a correlation matrix as an example, but the technique also applies to covariance matrices, distance matrices, or other symmetric matrices. If the diagonal elements are constant (they are 1 for a correlation matrix), you need to convert only the upper-triangular elements of the symmetric matrix. If the diagonal elements are not constant, you should include them in the output.
The following statements compute the Pearson correlation for all numeric variables for a subset of the Sashelp.Iris data. The OUTP= option writes the statistics to the CorrSym data set:
proc corr data=sashelp.iris(where=(Species="Setosa")) outp=CorrSym; var _numeric_; run; |
The structure of a TYPE=CORR data set is documented, but it is easy enough to figure out the structure by printing the data set, as follows:
proc print data=CorrSym; run; |
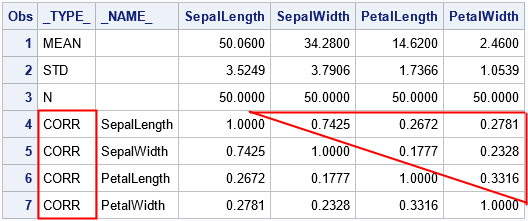
I have highlighted certain elements in the data set that are used in the next section. The goal is to display a list of the correlations inside the triangle.
Convert from a correlation matrix to a pairwise list
Notice that the correlations are identified by the rows where _TYPE_="CORR". Notice that the only numeric columns are the p variables that contain the correlations. You can therefore use a WHERE clause to subset the rows and use the _NUMERIC_ keyword to read the columns into an array. You can then iterate over the upper-triangular elements of the correlation matrix, as follows:
/* Convert a symmetric matrix of correlations into a three-column table. This is a "wide to long" conversion, but we need to display only the upper-triangular elements. Input: a dense symmetric matrix p x p matrix with elements C[i,j] for 1 <= i,j <= p Output: pairwise statistics by using the upper triangular elements. The output columns are Var1 Var2 Correlation */ data SymToPairs; set CorrSym(where=(_type_='CORR')); /* subset the rows */ Var1 = _NAME_; length Var2 $32; array _cols (*) _NUMERIC_; /* columns that contain the correlations */ do _i = _n_ + 1 to dim(_cols); /* iterate over STRICTLY upper-triangular values */ Var2 = vname(_cols[_i]); /* get the name of this column */ Correlation = _cols[_i]; /* get the value of this element */ output; end; keep Var1 Var2 Correlation; run; proc print data=SymToPairs noobs; run; |
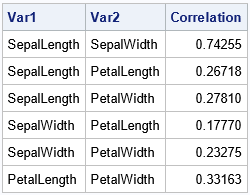
Success! The correlations which were in the upper-triangular portion of a p x p matrix (p=4 for this example) are now in the p(p-1)/2 rows of a table. Notice that the DATA step uses the VNAME function to obtain the name of a variable in an array. This is a useful trick.
This trick will work for any symmetric matrix in a data set. However, for statistics that are produced by other procedures, you must figure out which rows to extract and which variables to include on the ARRAY statement. If you are converting a matrix that does not have a constant diagonal, you can write the DO loop as follows:
do _i = _n_ to dim(_cols); /* iterate over diagonal AND upper-triangular values */ ... end; |
If you include the diagonal elements in the output, the list format will contain p(p+1)/2 rows. Try modifying the DATA step for the previous example to include the diagonal elements. You should get a table that has 10 rows. The correlation of each variable with itself is 1.
A rectangular array of correlations
The preceding sections show one way to convert a symmetric matrix of correlations into a list. You can use this technique when you have used the VAR statement in PROC CORR to compute all correlations between variables. Another common computation is to compute the correlations between one set of variables and another set. This is done by using the VAR and WITH statements in PROC CORR to define the two sets of variables. The result is a rectangular matrix of correlations. The matrix is not symmetric and does not contain 1s on the diagonal. Nevertheless, you can slightly modify the previous program to handle this situation:
proc corr data=sashelp.cars noprob outp=CorrRect; var EngineSize HorsePower MPG_Highway; with Length Wheelbase; run; /* Convert a rectangular matrix of correlations into a three-column table. Input: an (r x p) dense matrix of statistics Output: pairwise statistics in a table: Var1 Var2 Correlation */ data RectToPairs; set CorrRect(where=(_type_='CORR')); Var1 = _NAME_; length Var2 $32; array _cols (*) _NUMERIC_; do _i = 1 to dim(_cols); /* iterate over ALL values */ Var2 = vname(_cols[_i]); /* get the name of this column */ Correlation = _cols[_i]; /* get the value of this element */ output; end; keep Var1 Var2 Correlation; run; proc print data=RectToPairs noobs; run; |
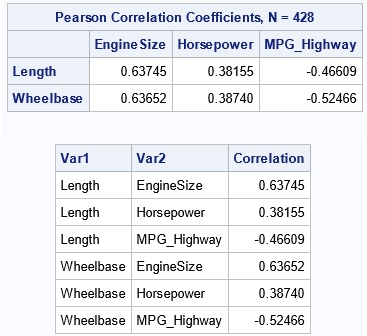
In this case, the original matrix is 2 x 3, and the converted list has 6 rows.
Summary
If you use PROC CORR in SAS to compute Pearson or Spearman correlations, you can use the FISHER option to display the correlations in list format. If you have a symmetric matrix of statistics from some other source, you can use a DATA step to display the upper-triangular elements in a list. You can choose to include or exclude the diagonal elements.
If you use the VAR and WITH statements in PROC CORR, you obtain a rectangular matrix of correlations, which is not symmetric. You can use the DATA step to display all elements in list format.
A table of pairwise statistics can be useful for visualizing the correlations in a bar chart or for highlighting correlations that are very large or very small. It is also possible to go the other way: From a list of all pairwise correlations, you can construct the symmetric correlation matrix.

3 Comments
Can I plug one of my favorite posts? It is hard to believe that I wrote it almost 5 years ago.
https://blogs.sas.com/content/graphicallyspeaking/2017/12/11/displaying-upper-lower-triangle-correlation-matrix/
For something visual that's not too abysmal- to visualise correlations at great scale, and to learn about yours in an interesting and useful way...
https://communities.sas.com/t5/SAS-Communities-Library/Large-scale-correlation-analysis-with-the-hyperGroup-CAS-Action/ta-p/612126
Go from tables, charts, and matrices (2-dimensional), to graphs (3-dimensional)- graphs here being the vertices and edges kind.
Yes, clustering variables that are highly correlated with each other is a useful process. I have shown how to use a process calls single-linked clustering to order/arrange variables according to any user-specified symmetric "merit matrix" (Hurley, 2004): https://blogs.sas.com/content/iml/2018/05/02/reorder-variables-correlation-heat-map.html