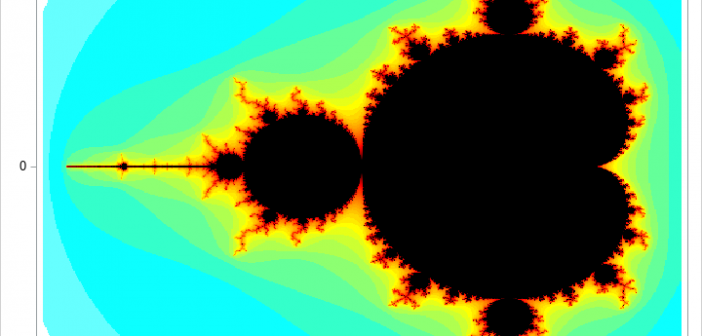
When my colleague, Robert Allison, blogged about visualizing the Mandelbrot set, I was reminded of a story from the 1980s, which was the height of the fractal craze. A research group in computational mathematics had been awarded a multimillion-dollar grant to purchase a supercomputer. When the supercomputer arrived and got

