Search Results: two ways to create ODS statistical graphics (53)

Programming Tips
Rick Wicklin 2
4 ways to standardize data in SAS

A common operation in statistical data analysis is to center and scale a numerical variable. This operation is conceptually easy: you subtract the mean of the variable and divide by the variable's standard deviation. Recently, I wanted to perform a slight variation of the usual standardization: Perform a different standardization

Analytics | Data Visualization
Rick Wicklin 10
Create biplots in SAS

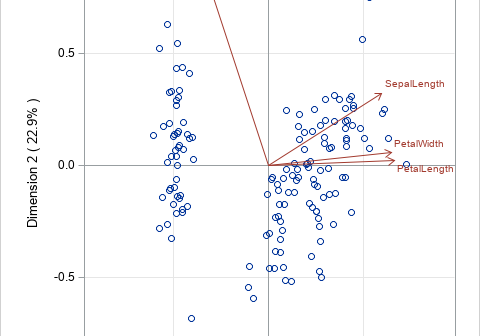
Biplots are two-dimensional plots that help to visualize relationships in high dimensional data. A previous article discusses how to interpret biplots for continuous variables. The biplot projects observations and variables onto the span of the first two principal components. The observations are plotted as markers; the variables are plotted as

1 2 3 6