Search Results: two ways to create ODS statistical graphics (53)

Learn SAS
Rick Wicklin 24
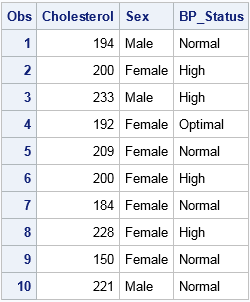
Create dummy variables in SAS

A dummy variable (also known as indicator variable) is a numeric variable that indicates the presence or absence of some level of a categorical variable. The word "dummy" does not imply that these variables are not smart. Rather, dummy variables serve as a substitute or a proxy for a categorical

Rick Wicklin 7
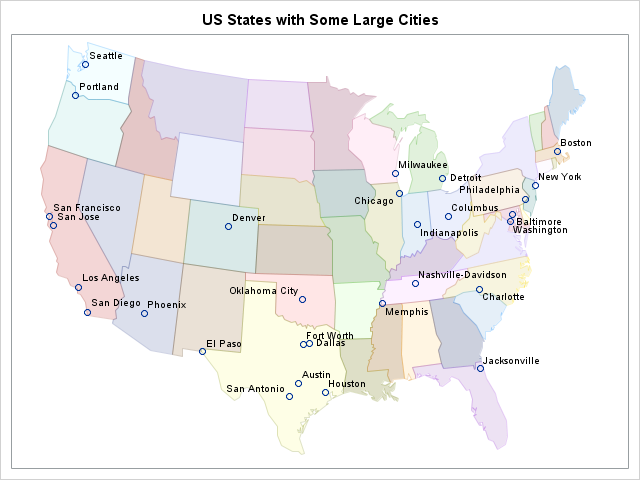
Create a map with PROC SGPLOT

Did you know that you can use the POLYGON statement in PROC SGPLOT to draw a map? The graph at the left shows the 48 contiguous states of the US, overlaid with markers that indicate the locations of major cities. The plot was created by using the POLYGON statement, which

Rick Wicklin 2
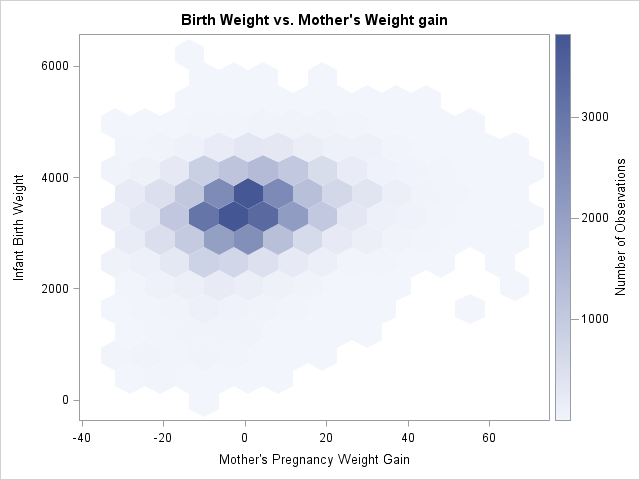
How to create a hexagonal bin plot in SAS

While I was working on my recent blog post about two-dimensional binning, a colleague asked whether I would be discussing "the new hexagonal binning method that was added to the SURVEYREG procedure in SAS/STAT 13.2." I was intrigued: I was not aware that hexagonal binning had been added to a

1 2 3 4 6