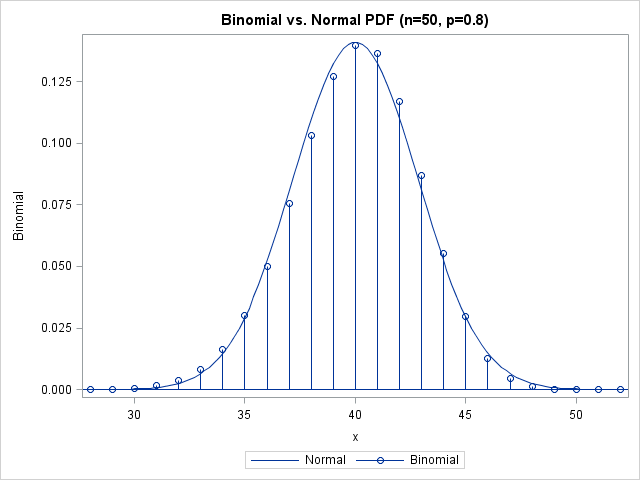
Most statistical programmers have seen a graph of a normal distribution that approximates a binomial distribution. The figure is often accompanied by a statement that gives guidelines for when the approximation is valid. For example, if the binomial distribution describes an experiment with n trials and the probability of success

