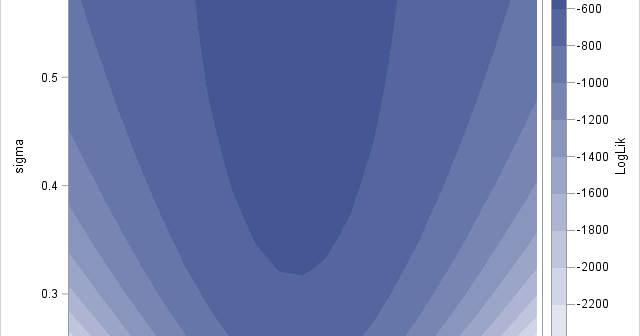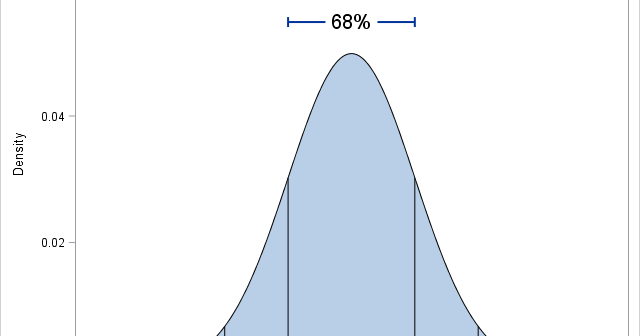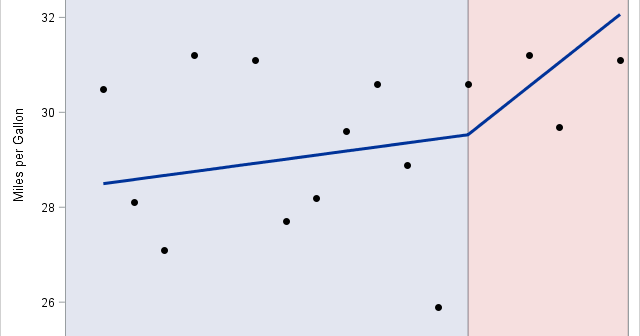
Graphs enable you to visualize how the predicted values for a regression model depend on the model effects. You can gain an intuitive understanding of a model by using the EFFECTPLOT statement in SAS to create graphs like the one shown at the top of this article. Many SAS regression
Tag: Statistical Programming
SAS software can fit many different kinds of regression models. In fact a common question on the SAS Support Communities is "how do I fit a <name> regression model in SAS?" And within that category, the most frequent questions involve how to fit various logistic regression models in SAS. There
Last week I showed how to use PROC EXPAND to compute moving averages and other rolling statistics in SAS. Unfortunately, PROC EXPAND is part of SAS/ETS software and not every SAS site has a license for SAS/ETS. For simple moving averages, you can write a DATA step program, as discussed
In SAS, the aspect ratio of a graph is the physical height of the graph divided by the physical width. Recently I demonstrated how to set the aspect ratio of graphs in SAS by using the ASPECT= option in PROC SGPLOT or by using the OVERLAYEQUATED statement in the Graph
I began 2016 by compiling a list of popular articles from my blog in 2015. This "People's Choice" list contains many interesting articles, but some of my personal favorites did not make the list. Today I present the "Editor's Choice" list of articles that deserve a second look. I've grouped
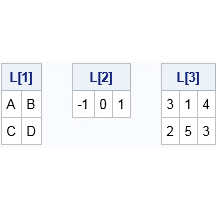
A matrix is a convenient way to store an array of numbers. However, often you need to extract certain elements from a matrix. The SAS/IML language supports two ways to extract elements: by using subscripts or by using indices. Use subscripts when you are extracting a rectangular portion of a
Sometimes I can't remember where I put things. If I lose my glasses or garden tools, I am out of luck. But when I can't remember where I put some data, I have SAS to help me find it. When I can remember the name of the data set, my
Did you know that the FREQ procedure in SAS can compute exact p-values for more than 20 statistical tests and statistics that are associated with contingency table? Mamma mia! That's a veritable smorgasbord of options! Some of the tests are specifically for one-way tables or 2 x 2 tables, but many apply
A friend who teaches courses about statistical regression asked me how to create a graph in SAS that illustrates an important concept: the conditional distribution of the response variable. The basic idea is to draw a scatter plot with a regression line, then overlay several probability distributions along the line,
Imagine the following scenario. You have many data sets from various sources, such as individual stores or hospitals. You use the SAS DATA step to concatenate the many data sets into a single large data set. You give the big data set to a colleague who will analyze it. Later