Did you know that you can check a SAS macro variable to see if ODS graphics is enabled? The other day I wanted to write a SAS program that creates a graph only if ODS graphics is enabled. The solution is to check the SYSODSGRAPHICS macro variable, which is automatically
Tag: SAS Programming
SAS formats are very useful and can be used in a myriad of creative ways. For example, you can use formats to display decimal values as a fraction. However, SAS supports so many formats that it is difficult to remember details about the format syntax, such as the default field
SAS programmers who have experience with other programming languages sometimes wonder whether the SAS language supports statements that are equivalent to the "break" and "continue" statements in other languages. The answer is yes. The LEAVE statement in the SAS DATA step is equivalent to the "break" statement. It provides a
I recently needed to solve a fun programming problem. I challenge other SAS programmers to solve it, too! The problem is easy to state: Given a long sequence of digits, can you write a program to count how many times a particular subsequence occurs? For example, if I give you
Suppose you have several discrete variables. You want to conduct a frequency analysis of these variables and print the results, but ONLY for variables that have three or more levels. In other words, you want to conditionally display some results, but you don't know which variables satisfy the condition until
After reading my article about how to use BY-group processing to run 1000 regression models, a SAS programmer asked whether it is possible to reorder the output of a BY-group analysis. The answer is yes: you can use the DOCUMENT procedure to replay a portion of your output in any
Longtime SAS programmers know that the SAS DATA step and SAS procedures are very tolerant of typographical errors. You can misspell most keywords and SAS will "guess" what you mean. For example, if you mistype "PROC" as "PRC," SAS will run the program but write a warning to the log:
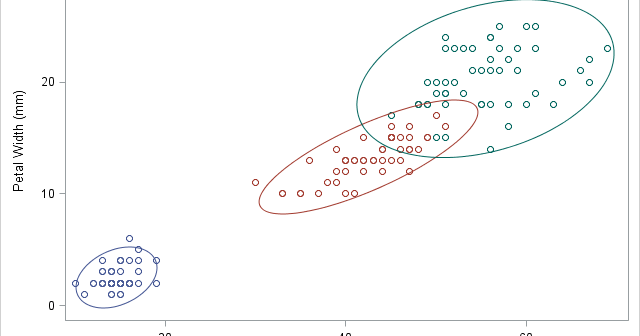
Suppose you create a scatter plot in SAS with PROC SGPLOT. What color does PROC SGPLOT use for the markers? If you specify the GROUP= option so that markers are colored by a grouping variable, what colors are used to represent the various groups? The following scatter plot shows the
For SAS programmers, the PUT statement in the DATA step and the %PUT macro statement are useful statements that enable you to display the values of variables and macro variables, respectively. By default, the output appears in the SAS log. This article shares a few tips that help you to
Do you want to create customized SAS graphs by using PROC SGPLOT and the other ODS graphics procedures? An essential skill that you need to learn is how to merge, join, append, and concatenate SAS data sets that come from different sources. The SAS statistical graphics procedures (SG procedures) enable