In the R programming language, you can use a negative index in order to exclude an element from a list or a row from a matrix. For example, the syntax x[-1] means "all elements of x except for the first." In general, if v is a vector of indices to
English
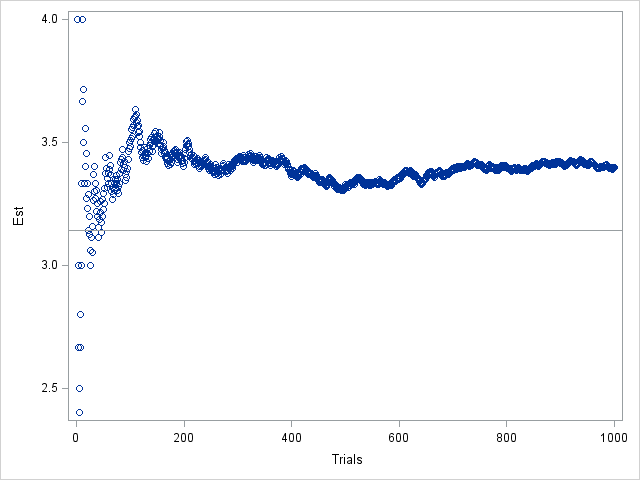
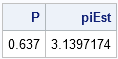
Buffon's needle experiment for estimating π is a classical example of using an experiment (or a simulation) to estimate a probability. This example is presented in many books on statistical simulation and is famous enough that Brian Ripley in his book Stochastic Simulation states that the problem is "well known
Hello, 2012! It's a New Year and I'm flushed with ideas for new blog articles. (You can also read about The DO Loop's most popular posts of 2011.) The fundamental purpose of my blog is to present tips and techniques for writing efficient statistical programs in SAS. I pledge to
At the beginning of 2011, I made four New Year's resolutions for my blog. As the year draws to a close, it's time to see how I did: Resolution: 100 blog posts in 2011: Completed. I blew by this goal by posting 165 articles. I recently compiled a list of
A few colleagues and I were exchanging short snippets of SAS code that create Christmas trees and other holiday items by using the SAS DATA step to arrange ASCII characters. For example, the following DATA step (contributed by Udo Sglavo) creates a Christmas tree with ornaments and lights: data _null_;
Since this is a blog about statistical programming and analysis, I am always looking for data to analyze. As 2011 ends, I look back on the 165 blog entries that I published since 01JAN2011. This article presents the 10 most popular posts, as determined by the number of people who
The SAS Output Delivery System (ODS) enables you to manage and customize tables (and graphics!) that are created by SAS procedures. I like to use the ODS SELECT statement to display only part of the output of a SAS procedure. For example, the UNIVARIATE procedure produces five tables by default,
Some SAS products such as SAS/IML Studio (which is included FREE as part of SAS/IML software) have interactive graphics. This makes it easy to interrogate a graph to determine values of "hidden" variables that might not appear in the graph. For example, in a scatter plot in SAS/IML Studio, you
Yesterday, December 7, 1941, a date which will live in infamy... - Franklin D. Roosevelt Today is the 70th anniversary of the Japanese attack on Pearl Harbor. The very next day, America declared war. During a visit to the Smithsonian National Museum of American History, I discovered the results of
In simulation studies, the response variable is often a binary (or Bernoulli) variable. Often 1 is used to indicate "success" (or the occurrence of an event) whereas 0 indicates "failure" (or the absence of an event). For example, the following SAS/IML statements define a vector x of zeros and ones: