Uncategorized

Rick Wicklin 5
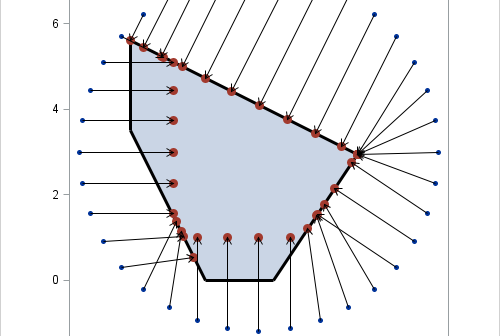
Compute highest density regions in SAS

In a scatter plot, the regions where observations are packed tightly are areas of high density. A contour plot or heat map of a bivariate kernel density estimate (KDE) is one way to visualize regions of high density. A SAS customer asked whether it is possible to use SAS to

Rick Wicklin 1
Female world leaders by year of election

This week Hillary Clinton became the first woman to be nominated for president of the US by a major political party. Although this is a first for the US, many other countries have already passed this milestone. In fact, 60 countries have already elected women as presidents and prime ministers.

Rick Wicklin 6
Absorbing Markov chains in SAS

Last week I showed how to represent a Markov transition matrix in the SAS/IML matrix language. I also showed how to use matrix multiplication to iterate a state vector, thereby producing a discrete-time forecast of the state of the Markov chain system. This article shows that the expected behavior of

Learn SAS
Rick Wicklin 10
Break a sentence into words in SAS

Two of my favorite string-manipulation functions in the SAS DATA step are the COUNTW function and the SCAN function. The COUNTW function counts the number of words in a long string of text. Here "word" means a substring that is delimited by special characters, such as a space character, a

1 75 76 77 78 79 151