Do you know that you can create a vector that has a specific correlation with another vector? That is, given a vector, x, and a correlation coefficient, ρ, you can find a vector, y, such that corr(x, y) = ρ. The vectors x and y can have an arbitrary number of elements, n > 2. One application of this technique is to create a scatter plot that shows correlated data for any correlation in the interval (-1, 1). For example, you can create a scatter plot with n points for which the correlation is exactly a specified value, as shown at the end of this article.
The algorithm combines a mixture of statistics and basic linear algebra. The following facts are useful:
- Statistical correlation is based on centered and normalized vectors. When you center a vector, it usually changes the direction of the vector. Therefore, the calculations use centered vectors.
- Correlation is related to the angle between the centered vectors. If the angle is θ, the correlation between the vectors is cos(θ).
- Projection is the key to finding a vector that has a specified correlation. In linear algebra, the projection of a vector w onto a unit vector u is given by the expression (w`u)*u.
- Affine transformations do not affect correlation. For any real number, α, and for any β > 0, the vector α + β y has the same correlation with x as y does. For simplicity, the SAS program in this article returns a centered unit vector. You can scale and translate the vector to obtain other solutions.
The geometry of a correlated vector
Given a centered vector, u, there are infinitely-many vectors that have correlation ρ with u. Geometrically, you can choose any vector on a positive cone in the same direction as u, where the cone has angle θ and cos(θ)=ρ. This is shown graphically in the figure below. The plane marked \(\mathbf{u}^{\perp}\) is the orthogonal complement to the vector u. If you extend the cone through the plane, you obtain the cone of vectors that are negatively correlated with x
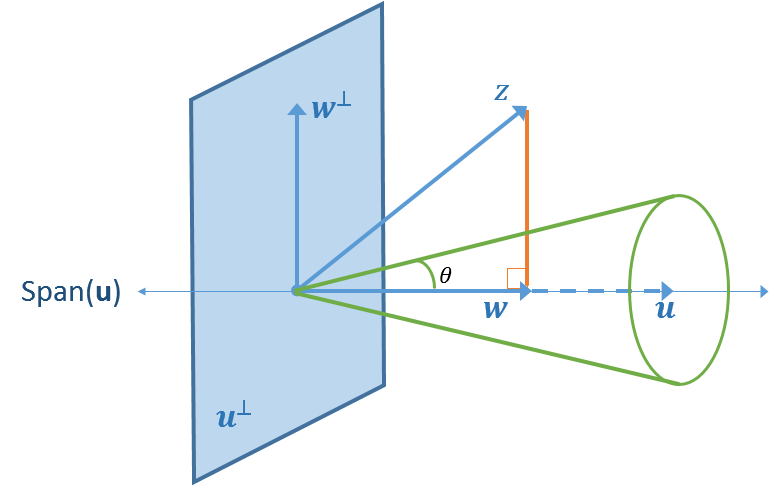
One way to obtain a correlated vector is to start with a guess, z. The vector z can be uniquely represented as the sum \(\mathbf{y} = \mathbf{w} + \mathbf{w}^{\perp}\), where w is the projection of z onto the span of u, and \(\mathbf{w}^{\perp}\) is the projection of z onto the orthogonal complement.
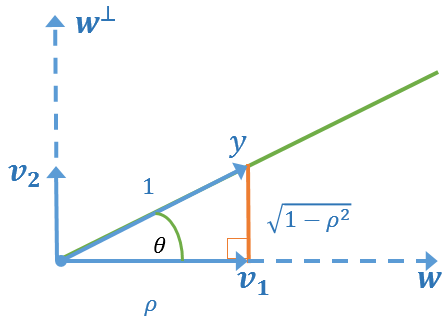
The following figure shows the geometry of the right triangle with angle θ such that cos(θ) = ρ.
If you want the vector y to be unit length, you can read off the formula for y from the figure. The formula is
\(\mathbf{y} = \rho \mathbf{w} / \lVert\mathbf{w}\rVert + \sqrt{1 - \rho^2} \mathbf{w}^\perp / \lVert\mathbf{w}^\perp\rVert \)
In the figure, \(\mathbf{v}_1 = \mathbf{w} / \lVert\mathbf{w}\rVert\) and
\(\mathbf{v}_2 = \mathbf{w}^\perp / \lVert\mathbf{w}^\perp\rVert\).
Compute a correlated vector
It is straightforward to implement this projection in a matrix-vector language such as SAS/IML. The following program defines two helper functions (Center and UnitVec) and uses them to implement the projection algorithm. The function CorrVec1 takes three arguments: the vector x, a correlation coefficient ρ, and an initial guess. The function centers and scales the vectors into the vectors u and z. The vector z is projected onto the span of u. Finally, the function uses trigonometry and the fact that cos(θ) = ρ to return a unit vector that has the required correlation with x.
/* Given a vector, x, and a correlation, rho, find y such that corr(x,y) = rho */ proc iml; /* center a column vector by subtracting its mean */ start Center(v); return ( v - mean(v) ); finish; /* create a unit vector in the direction of a column vector */ start UnitVec(v); return ( v / norm(v) ); finish; /* Find a vector, y, such that corr(x,y) = rho. The initial guess can be almost any vector that is not in span(x), orthog to span(x), and not in span(1) */ start CorrVec1(x, rho, guess); /* 1. Center the x and z vectors. Scale them to unit length. */ u = UnitVec( Center(x) ); z = UnitVec( Center(guess) ); /* 2. Project z onto the span(u) and the orthog complement of span(u) */ w = (z`*u) * u; wPerp = z - w; /* 3. The requirement that cos(theta)=rho results in a right triangle where y (the hypotenuse) has unit length and the legs have lengths rho and sqrt(1-rho^2), respectively */ v1 = rho * UnitVec(w); v2 = sqrt(1 - rho**2) * UnitVec(wPerp); y = v1 + v2; /* 4. Check the sign of y`*u. Flip the sign of y, if necessary */ if sign(y`*u) ^= sign(rho) then y = -y; return ( y ); finish; |
The purpose of the function is to project the guess onto the green cone in the figure. However, if the guess is in the opposite direction from x, the algorithm will compute a vector, y, that has the opposite correlation. The function detects this case and flips y, if necessary.
The following statements call the function for a vector, x, and requests a unit vector that has correlation ρ = 0.543 with x:
/* Example: Call the CorrVec1 function */ x = {1,2,3}; rho = 0.543; guess = {0, 1, -1}; y = CorrVec1(x, rho, guess); corr = corr(x||y); print x y, corr; |
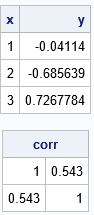
As requested, the correlation coefficient between x and y is 0.543. This process will work provided that the guess satisfies a few mild assumptions. Specifically, the guess cannot be in the span of x or in the orthogonal complement of x. The guess also cannot be a multiple of the 1 vector. Otherwise, the process will work for positive and negative correlations.
The function returns a vector that has unit length and 0 mean. However, you can translate the vector and scale it by any positive quantity without changing its correlation with x, as shown by the following example:
/* because correlation is a relationship between standardized vectors, you can translate and scale Y any way you want */ y2 = 100 + 23*y; /* rescale and translate */ corr = corr(x||y2); /* the correlation will not change */ print corr; |

When y is a centered unit vector, the vector β*y has L2 norm β. If you want to create a vector whose standard deviation is β, use β*sqrt(n-1)*y, where n is the number of elements in y.
Random vectors with a given correlation
One application of this technique is to create a random vector that has a specified correlation with a given vector, x. For example, in the following program, the x vector contains the heights of 19 students in the Sashelp.Class data set. The program generates a random guess from the standard normal distribution and passes that guess to the CorrVec1 function and requests a vector that has the correlation 0.678 with x. The result is a centered unit vector.
use sashelp.class; read all var {"Height"} into X; close; rho = 0.678; call randseed(123); guess = randfun(nrow(x), "Normal"); y = CorrVec1(x, rho, guess); mean = 100; std = 23*sqrt(nrow(x)-1); v = mean + std*y; title "Correlation = 0.678"; title2 "Random Normal Vector"; call scatter(X, v) grid={x y}; |
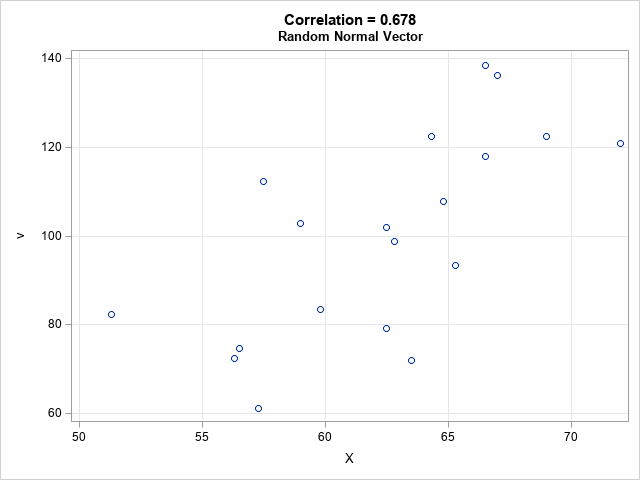
The graph shows a scatter plot between x and the random vector, v. The correlation in the scatter plot is 0.678. The sample mean of the vector v is 100. The sample standard deviation is 23.
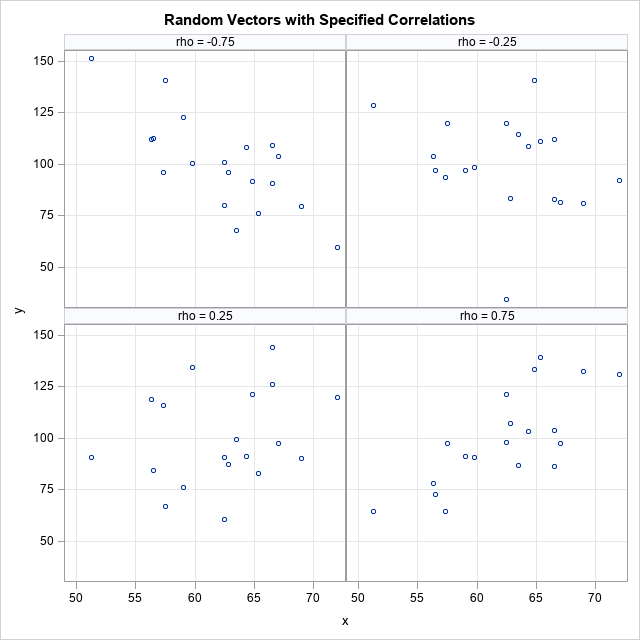
If you make a second call to the RANDFUN function, you can get another random vector that has the same properties. Or you can repeat the process for a range of ρ values to visualize data that have a range of correlations. For example, the following graph shows a panel of scatter plots for ρ = -0.75, -0.25, 0.25, and 0.75. The X variable is the same for each plot. The Y variable is a random vector that was rescaled to have mean 100 and standard deviation 23, as above.
The random guess does not need to be from the normal distribution. You can use any distribution.
Summary
This article shows how to create a vector that has a specified correlation with a given vector. That is, given a vector, x, and a correlation coefficient, ρ, find a vector, y, such that corr(x, y) = ρ. The algorithm in this article produces a centered vector that has unit length. You can multiply the vector by β > 0 to obtain a vector whose norm is β. You can multiply the vector by β*sqrt(n-1) to obtain a vector whose standard deviation is β.
There are infinitely-many vectors that have correlation ρ with x. The algorithm uses a guess to produce a particular vector for y. You can use a random guess to obtain a random vector that has a specified correlation with x.

3 Comments
Pingback: Create a response variable that has a specified R-square value - The DO Loop
Dear Rick,
fantastic post, as always. I was just wondering: How did you create the first figure? Which program did you use?
Best from Ulm,
Daniel
Thanks for writing. I'm glad you enjoyed it. I created the first two figures by using PowerPoint.