Weighted averages are all around us. Teachers use weighted averages to assign a test more weight than a quiz. Schools use weighted averages to compute grade-point averages. Financial companies compute the return on a portfolio as a weighted average of the component assets. Financial charts show (linearly) weighted moving averages or exponentially-weighted moving averages for stock prices.
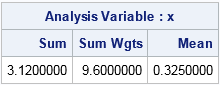
The weighted average (or weighted mean, as statisticians like to call it) is easy to compute in SAS by using either PROC MEANS or PROC UNIVARIATE. Use the WEIGHT statement to specify a weight variable (w), and use the VAR statement as usual to specify the measurement variable (x). The formula for the weighted mean is the ratio of sums Σ wixi / Σ wi. The following example computes the numerator (weighted sum), the denominator (sum of weights), and the weighted mean for a set of eight data points. For these data and weights, the weighted sum is 0.325:
data Wt; input x wt; datalines; -2 1 -1.5 0.8 -1.2 0.5 -0.5 1 0 1 0.8 1.5 1.4 2.3 2.0 1.5 ; proc means data=Wt sum sumwgt mean; weight wt; var x; run; |
The WEIGHT statement is supported in many SAS procedures. By convention, weights are positive values, so any observations that contain missing or nonpositive weights are excluded from the computation.
Weighted means in SAS/IML software
The computation of the weighted mean is easy to program in SAS/IML software. Recall that the elementwise multiplication operator (#) computes the elementwise product of two vectors. If there are no missing values in the data and all the weights are positive, then the SAS/IML statement m = WtMean = sum(x#w) / sum(w) computes the weighted mean of the X values weighted by W.
For consistency with the rest of SAS, the following function excludes observations for which the X value is missing or for which the weight variable is not positive. Consequently, the following function duplicates the computation is used by PROC MEANS and PROC UNIVARIATE:
proc iml;
start WtMean(x, w);
   idx = loc(x^=. & w>0);                /* use only valid observations */
   if ncol(idx)=0 then return(.);        /* no valid obs; return missing */
   m = sum(x[idx]#w[idx]) / sum(w[idx]); /* compute weighted mean */
   return( m );
finish;

use Wt;   read all var {x wt};   close Wt;  /* read the example data */
WtMean = WtMean(x, wt);                     /* test the function */
print WtMean;

call symputx("xbar", WtMean);            /* store value in macro var for later */
quit; |
The result (not shown) is the same as reported by PROC MEANS. The SYMPUTX call creates a macro variable xbar that contains the value of the weighted mean for this example. This macro variable is used in the next section.
Visualizing a weighted mean
Weighted distributions are not always easy to visualize, and for this reason PROC UNIVARIATE does not support creating graphs of weighted analyses. However, weighted means have a simple physical interpretation.
Compute and visualize a weighted mean #Sastip Share on XFor the usual unweighted mean, imagine placing N identical point masses at the locations x1, x2, ..., xN along a massless rod. (An idealized point mass has no extent; the mass is concentrated at a single mathematical point.) The mean value of the X values is the center of mass for the point masses: the location at which the rod is perfectly balanced. In a similar way, the weighted mean is the location of the center of mass for a system of N point masses in which the mass wi is placed at the locations xi.
You can use a bubble plot to depict the physical arrangement of masses for this example. Instead of an idealized point mass, the bubble plot enables you to represent each mass by a circle whose size is related to the mass. The SIZE= option for the BUBBLE statement in PROC SGPLOT determines the diameter of the bubbles, but mass is proportional to area (actually volume, but I'm going to use a 2-D picture), so I use the square root of the weight to determine the size of each bubble. This trick ensures that the area of the bubbles is proportional to the weight.
The following DATA step computes the square root of each weight and adds a horizontal coordinate, y=0. The call to PROC SGPLOT creates the bubble plot. The REFLINE statement displays the massless rod. A drop line is shown at the center of mass for this system; the horizontal position is the valueof the xbar macro variable that was previously computed. (You can imagine that the system is perfectly balanced on the tip of a needle.) Finally, the TEXT statement (added in SAS 9.4m2) displays the weight of each mass. For earlier releases of SAS, you can use the MARKERCHAR= option in the SCATTER statement to display the weights.
data Bubble; set Wt; y = 0; radius = sqrt(Wt); run; ods graphics / width = 400px height=200px; proc sgplot data=Bubble noautolegend; refline 0 / axis=y; dropline x=&xbar y=0 / dropto=x; bubble x=x y=y size=radius; text x=x y=y text=wt / strip; /* or scatter x=x y=y / markerchar=wt; */ yaxis display=none; run; |
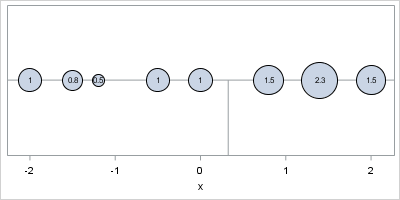
In the graph, the five small masses to the left of the center of mass are balanced by the three larger masses to the right of the center of mass.
Although this example is one-dimensional, you can use the weighted mean computation to compute the center of mass for a two-dimensional collection of point masses: the X coordinates of the points are used to compute the X coordinate of the center of mass, and he Y coordinate for the center of mass is computed similarly. The bubble plot is easily modified to represent the two-dimensional arrangement.
In summary, the weighted mean is easy to compute and fun to visualize in SAS. Have you needed to compute a weighted mean? What did the weights represent? Leave a comment.

16 Comments
Hello Rick,
can you tell me how to calculate weighted averages in this example:
data premium;
input id fraction premium;
datalines;
1 1 1000
2 0.5 500
run;
Customers 1 and 2 payed the same premium, but no. 2 was insured for only six months.
The received premium is 1000 per year, so in my opinion the average paid premium is 1000.
proc means mean;
weight fraction;
var premium;
run;
However proc means delivers 833 as the average premium.
Currently I solve this by summing fraction and premium and divide.
Is there a solution using proc means?
Thanks,
Eric
It sounds like you want the average ANNUALIZED premium. Define ANNUALIZED = premium / fraction and compute the regular (unweighted) mean.
Rick,
This would mean calculating many new variables (premium reduction, claims cost, commission) - I hoped that some procedure could do this correction for me.
Thanks anyway,
Eric
Look into PROC SQL or PROC REPORT. You can ask SAS programming questions at the SAS Support Communities.
Pingback: Compute the centroid of a polygon in SAS
Dear Dr. Wicklin,
Thank you so much for nice postings. I have a question regarding the releases/versions of SAS/STAT. My SAS is SAS 9.4 TS Level 1M2 and when I load SAS it says at log window: Updated Analytical Products: SAS/STAT 13.2. I came to know the "Enhancement of SAS/STAT 14.1" is released about 6 months back which added a new option FASTQUAD for better performance of PROC GLIMMIX. please see http://support.sas.com/rnd/app/stat/14.1/index.html How can we add this feature of SAS in my current SAS software? Thanking you again.
Moshiur
SAS/STAT 14.1 was released as part of SAS 9.4m3 software. (For a table that connects each SAS/STAT release to the corresponding version of SAS, see the article "How old is your version of SAS?") You cannot just add the GLIMMIX feature to your current release. You would need to upgrade to SAS 9.4m3, which would give you that feature and many others.
Pingback: Banking to 45 degrees: Aspect ratios for time series plots
Pingback: What is a moving average? - The DO Loop
Pingback: Rolling statistics in SAS/IML - The DO Loop
Pingback: Visualize a weighted regression - The DO Loop
Pingback: Weighted percentiles - The DO Loop
Hi Rick,
Thank you for your interesting SAS articles on analytics. I have a question related to weighted mean. I am looking for a method to estimate a weighted mean (score) considering both (i) weights varying based on importance of variables/items used and (ii) importance in considering multiple occurrences (frequency) of an item/variable. Generally weighted average doesn't consider the impacts of multiple occurrences of the same item. How can I make weighted average score based on the impact of both importance and frequency(?) using SAS. Thank you.
Use a WEIGHT statement to specify the weights and a FREQ statement to specify the frequencies (multiplicity).
Do you think, whether I can use logarithmic weighing function for frequency say log(1+f) to dampen the frequency values. How do we do the normalization factor to get the weighted mean if I combined with the importance of the items (it us expressed in another weights). Appreciate it if you could show a simple SAS Code for getting the weighted score. An example table is given for your information
Items frequency Item_weight Weights_DuetoImportance
V1 2 0.34 3
V2 1 0.15 1.5
V3 1 0.04 2
V4 3 0.12 1
V5 7 0.24 2
V6 1 0.1 2.5
V7 1 0.15 3
--------
-------
-----
V128 2 0.14 2
I am not sure how can I combined the effects of both the multiple occurrences(frequency) and importance to get the combined impact for getting a weighted average score?
Appreciate your help. Thank you
This isn't a coding question, it is a statistical question, so I suggest you ask it on a statistical discussion forum such as CrossValidated. After you decide how you want to weight each observation, then put that value in a variable and use it on the WEIGHT statement. For example, if you decide to multiply the frequency, item weight, and importance weight together, then you would create
w = frequency * Item_weight * Weights_DuetoImportance;
Be warned, however, that you are essentially "inventing" a weight, so none of the inferential statistics (such as standard errors, degrees of freedom, and p-values) are going to be applicable.