A moving average (also called a rolling average) is a statistical technique that is used to smooth a time series. Moving averages are used in finance, economics, and quality control. You can overlay a moving average curve on a time series to visualize how each value compares to a rolling average of previous values. For example, the following graph shows the monthly closing price of IBM stock over a 20-year period. Three kinds of moving averages are overlaid on a scatter plot of the data.
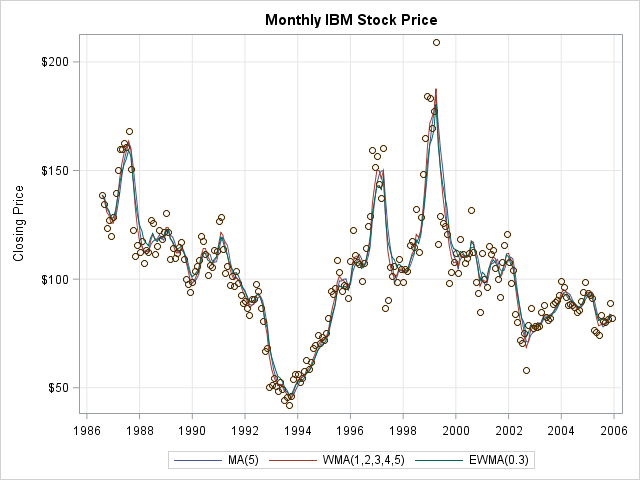
The IBM stock price increased in some time periods and decreased in others. The moving-average curves help to visualize these trends and identify these time periods. For a simple moving average, the smoothness of a curve is determined by the number of time points, k, that is used to compute the moving average. Small values of k result in curves that reflect the short-term ups and downs of the data; large values of k undulate less. For stock charts that show daily prices, the 30-day moving average and the 5-day moving average are popular choices.
How do you define a moving average?
The most common moving averages are the simple moving average (MA), the weighted moving average (WMA), and the exponentially weighted moving average (EWMA). The following list provides a brief description and mathematical formula for these kinds of moving averages. See the Wikipedia article on moving averages for additional details.
Let {y0, y1, ..., yt, ...} be the time series that you want to smooth, where yt is the value of the response at time t.
- The simple moving average at time t is the arithmetic mean of the series at yt and the previous k-1 time points. In symbols,
MA(t; k) = (1/k) Σ yi
where the summation is over the k values {yt-k+1, ..., yt}. - The weighted moving average (WMA) at time t is a weighted average of the series at yt and the previous k-1 time points. Typically the weights monotonically decrease so that data from "long ago" contribute less to the average than recent data. If
the weights sum to unity (Σ wi = 1) then
WMA(t; k) = Σ wi yi
If the weights do not sum to unity, then divide that expression by Σ wi. -
The exponentially weighted moving average (EWMA) does not use a finite rolling window. Instead of the parameter k, the EWMA uses a decay parameter α, where 0 < α < 1. The smoothed value at time t is defined recursively as
EWMA(t; α) = α yt + (1 - α) EWMA(t-1; α)
You can "unwind" this equation to obtain the EWMA as a WMA where the weights decrease geometrically. The choice of α determines the smoothness of the EWMA. A value of α ≈ 1 implies that older data contribute very little to the average. Conversely, small values of α imply that older data contribute to the moving average almost as much as newer data.
Each of these definitions contains an ambiguity for the first few values of the moving average. For example, if t < k, then there are fewer than k previous values in the MA and WMA methods. Some practitioners assign missing values to the first k-1 values, whereas others average the values even when fewer than k previous data points exist. For the EWMA, the recursive definition requires a value for EWMA(0; α), which is often chosen to be y0.
My next blog post shows how to compute various moving averages in SAS. The article shows how to create the IBM stock price example, which is a time series plot overlaid with MA, WMA, and EWMA curves.

6 Comments
Being a research student, I found this information really helpful for me. Now I am more cleared on this moving average.
Jyoti Koirala
Kathmandu,
Nepal
Pingback: Compute a moving average in SAS - The DO Loop
Pingback: Rolling statistics in SAS/IML - The DO Loop
Hi Rick,
Your Article is very useful but if i want to calculate moving average with base SAS code, How i can do that?
kaushal
Read the next blog post: "Compute a moving average in SAS." At the end of the post is a discussion of options that use Base SAS.
Pingback: SAS Visual Analytics example: moving average - SAS Users