Author

Rick Wicklin
RSS
Distinguished Researcher in Computational Statistics

Rick Wicklin, PhD, is a distinguished researcher in computational statistics at SAS and is a principal developer of SAS/IML software. His areas of expertise include computational statistics, simulation, statistical graphics, and modern methods in statistical data analysis. Rick is author of the books Statistical Programming with SAS/IML Software and Simulating Data with SAS.

Rick Wicklin 14
Lo, how a polar rose e'er blooming

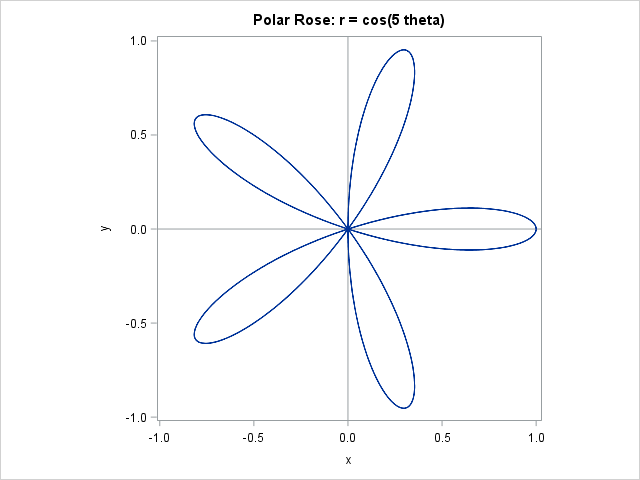
Lo how a rose e'er blooming From tender stem hath sprung As I write this blog post, a radio station is playing Chrismas music. One of my favorite Christmas songs is the old German hymn that many of us know as "Lo, How a Rose E're Blooming." I was humming

Rick Wicklin 2
Overlay categories on a histogram

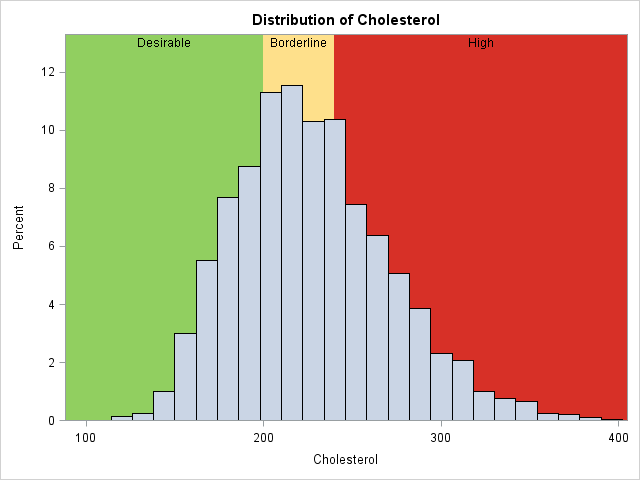
Recently Sanjay Matange blogged about how to color the bars of a histogram according to a gradient color ramp. Using the fact that bar charts and histograms look similar, he showed how to use PROC SGPLOT in SAS to plot a bar chart in which each bar is colored according

Rick Wicklin 3
Arrange matrices and graphs in a gridded layout

Last week my colleague Chris Hemedinger published a blog post that described how to use the ODS LAYOUT GRIDDED statement to arrange tables and graphs in a panel. The statement was introduced in SAS 9.4m1 (December 2013). Gridded layout is supported for HTML, POWERPOINT, and the PRINTER family of destinations

Rick Wicklin 7
Create a map with PROC SGPLOT

Did you know that you can use the POLYGON statement in PROC SGPLOT to draw a map? The graph at the left shows the 48 contiguous states of the US, overlaid with markers that indicate the locations of major cities. The plot was created by using the POLYGON statement, which

1 80 81 82 83 84 150