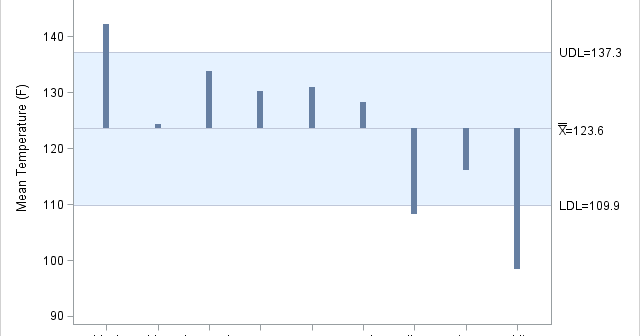
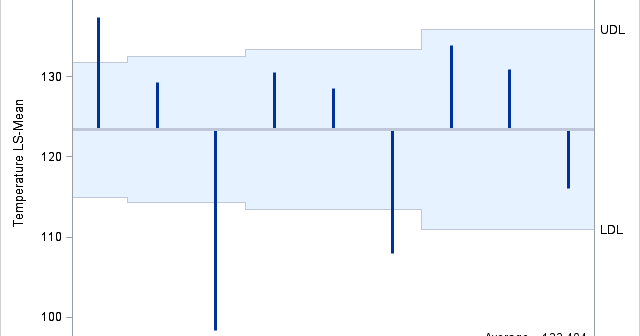
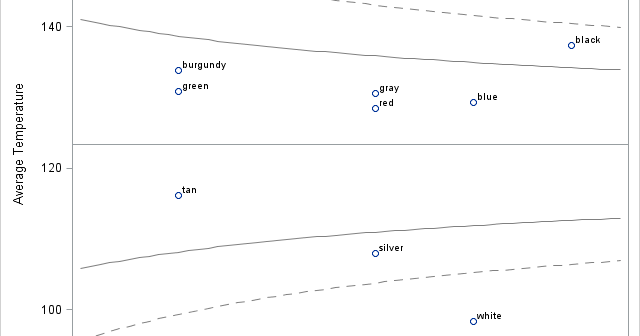
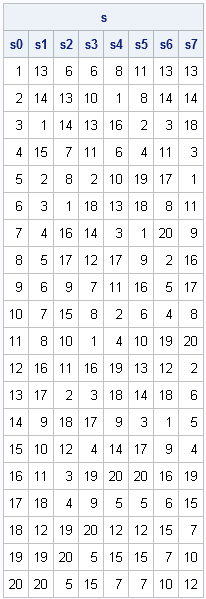
My last post was a criticism of a statistical graph that appeared in Bloomberg Businessweek. Criticism is easy. Analysis is harder. In this post I re-analyze the data to present two graphics that I think should have replaced the one graphic in Businessweek. You can download the SAS program that
Author
Recently I read a blog that advertised a data visualization competition. Under the heading "What Are We Looking For?" is a link to a 2007 Bloomberg Businessweek graph that visualizes how participation in online social media activities vary across age groups. The graph is reproduced below at a smaller scale:
Errors. We all make them. After all, “to err is human.” Or, as programmers often say, “To err is human, but to really foul things up requires a computer” (Farmer’s Almanac, 1978). This post describes how to interpret error messages from PROC IML that appear in the SAS log. The
I am thankful to be a statistical programmer. When I wake up in the morning, I am eager to start my day. I love statistics, programming, and working at SAS, and I write my blog to share that joy. This a Golden Age for statistical programmers because theoretical ideas and
I give many presentations and workshops on how to use SAS/IML Studio, and more than once I have been asked about how to launch the program. Sometimes the inquiry hints at mild frustration, such as last week's "How do I RUN the $%#@# THING!!!!" The email I got this week
In a previous post, I used statistical data analysis to estimate the probability that my grocery bill is a whole-dollar amount such as $86.00 or $103.00. I used three weeks' grocery receipts to show that the last two digits of prices on items that I buy are not uniformly distributed.
In a previous post, I discussed computing regression coefficients in different polynomial bases and showed how the coefficients change when you change the basis functions. In particular, I showed how to convert the coefficients computed in one basis to coefficients computed with respect to a different basis. It turns out
I am pleased to announce that the fine folks at SAS Press have made Chapter 2 of my book, Statistical Programming with SAS/IML Software available as a free PDF document. The chapter is titled "Getting Started with the SAS/IML Matrix Programming Language," and it features More than 60 fully functional
The other day I was at the grocery store buying a week's worth of groceries. When the cashier, Kurt (not his real name), totaled my bill, he announced, "That'll be ninety-six dollars, even." "Even?" I asked incredulously. "You mean no cents?" "Yup," he replied. "It happens." "Wow," I said, with
Chris started a tradition for SAS Press authors to post a photo of themselves with their new book. Thanks to everyone who helped with the production of Statistical Programming with SAS/IML Software.