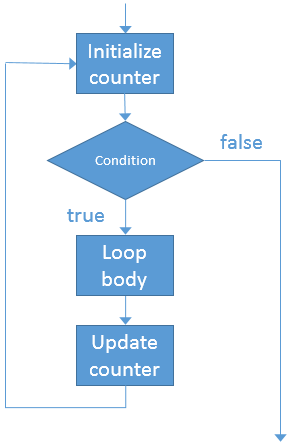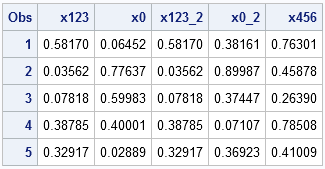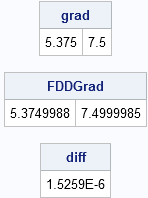
Andrew Ratcliffe posted a fine article titled "Inadequate Mends" in which he extols the benefits of including the name of a macro on the %MEND statement. That is, if you create a macro function named foo, he recommends that you include the name in two places: %macro foo(x); /** define
Tag: Statistical Programming
A fundamental operation in data analysis is finding data that satisfy some criterion. How many people are older than 85? What are the phone numbers of the voters who are registered Democrats? These questions are examples of locating data with certain properties or characteristics. The SAS DATA step has a
In last week's article on how to create a funnel plot in SAS, I wrote the following comment: I have not adjusted the control limits for multiple comparisons. I am doing nine comparisons of individual means to the overall mean, but the limits are based on the assumption that I'm
The log transformation is one of the most useful transformations in data analysis. It is used as a transformation to normality and as a variance stabilizing transformation. A log transformation is often used as part of exploratory data analysis in order to visualize (and later model) data that ranges over
In a previous blog post, I showed how you can use simulation to construct confidence intervals for ranks. This idea (from a paper by E. Marshall and D. Spiegelhalter), enables you to display a graph that compares the performance of several institutions, where "institutions" can mean schools, companies, airlines, or
I recently returned from a five-day conference in Las Vegas. On the way there, I finally had time to read a classic statistical paper: Bayer and Diaconis (1992) describes how many shuffles are needed to randomize a deck of cards. Their famous result that it takes seven shuffles to randomize
In my article on computing confidence intervals for rankings, I had to generate p random vectors that each contained N random numbers. Each vector was generated from normal distribution with different parameters. This post compares two different ways to generate p vectors that are sampled from independent normal distributions. Sampling
In a previous post, I described how to compute means and standard errors for data that I want to rank. The example data (which are available for download) are mean daily delays for 20 US airlines in 2007. The previous post carried out steps 1 and 2 of the method
I recently posted an article about representing uncertainty in rankings on the blog of the ASA Section for Statistical Programmers and Analysts (SSPA). The posting discusses the importance of including confidence intervals or other indicators of uncertainty when you display rankings. Today's article complements the SSPA post by showing how
I recently blogged about how to eliminate a macro loop in favor of using SAS/IML language statements. The purpose of the program was to extract N 3x3 matrices from a big 3Nx3 matrix. The main portion of my PROC IML program looked something like this: proc iml; ... do i=0