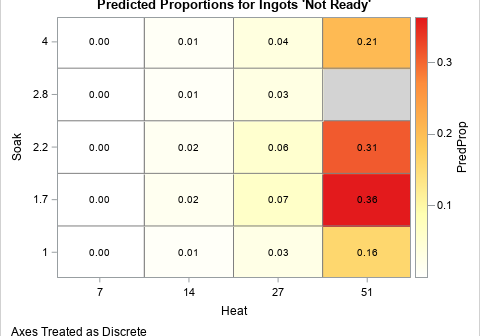
In statistical tables in SAS, a dot (.) represents a numerical missing value. Although a dot is the default symbol in SAS, other languages use other symbols. The R language prints the symbol NA, which stands for "not available." The MATLAB language uses NaN ("Not a Number"). In Python, many

