Uncategorized

Learn SAS
Rick Wicklin 5
Choosing bins for histograms in SAS

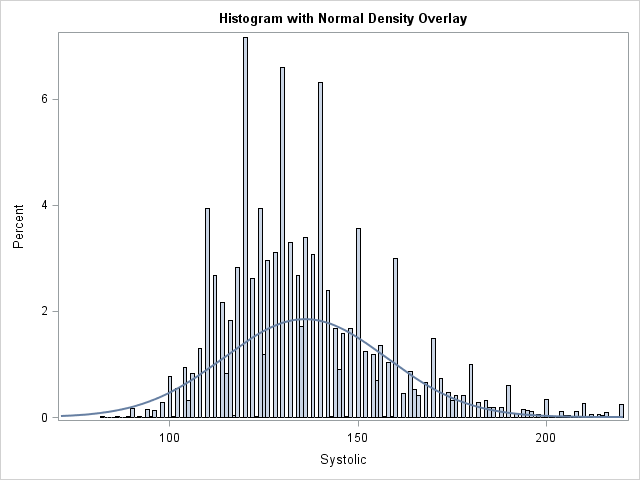
When you create a histogram with statistical software, the software uses the data (including the sample size) to automatically choose the width and location of the histogram bins. The resulting histogram is an attempt to balance statistical considerations, such as estimating the underlying density, and "human considerations," such as choosing

Rick Wicklin 17
Creating heat maps in SAS/IML

In a previous blog post, I showed how to use the graph template language (GTL) in SAS to create heat maps with a continuous color ramp. SAS/IML 13.1 includes the HEATMAPCONT subroutine, which makes it easy to create heat maps with continuous color ramps from SAS/IML matrices. Typical usage includes

Rick Wicklin 8
Creating a basic heat map in SAS

Heat maps have many uses. In a previous article, I showed how to use heat maps with a discrete color ramp to visualize matrices that have a small number of unique values, such as certain covariance matrices and sparse matrices. You can also use heat maps with a continuous color

Rick Wicklin 8
Stigler's seven pillars of statistical wisdom

Wisdom has built her house; She has hewn out her seven pillars.      – Proverbs 9:1 At the 2014 Joint Statistical Meetings in Boston, Stephen Stigler gave the ASA President's Invited Address. In forty short minutes, Stigler laid out his response to the age-old question "What is statistics?" His answer was

Rick Wicklin 2
Reversing the limits of integration in SAS

In SAS software, you can use the QUAD subroutine in the SAS/IML language to evaluate definite integrals on an interval [a, b]. The integral is properly defined only for a < b, but mathematicians define the following convention, which enables you to make sense of reversing the limits of integration:

1 97 98 99 100 101 151