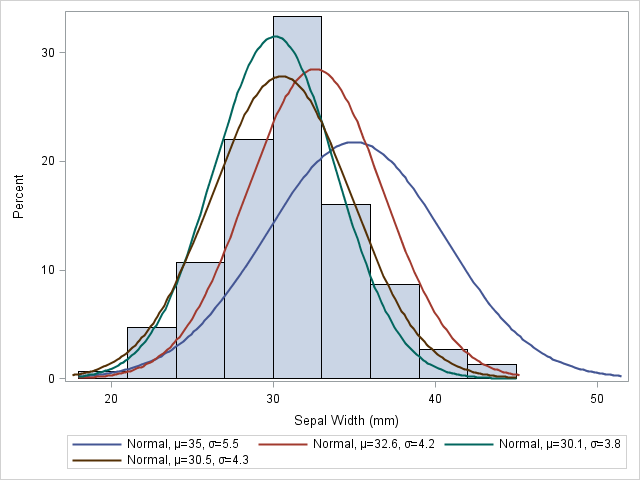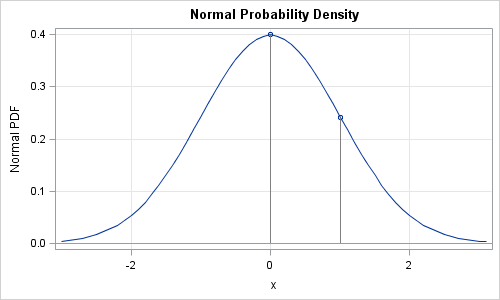
Normal, Poisson, exponential—these and other "named" distributions are used daily by statisticians for modeling and analysis. There are four operations that are used often when you work with statistical distributions. In SAS software, the operations are available by using the following four functions, which are essential for every statistical programmer


