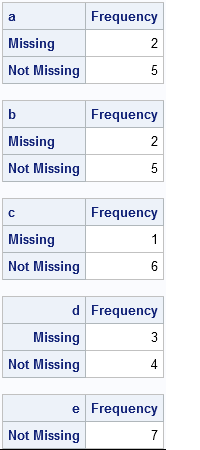
More than a month ago I wrote a first article in response to an interesting article by Charlie H. titled Top 10 most powerful functions for PROC SQL. In that article I described SAS/IML equivalents to the MONOTONIC, COUNT, N, FREQ, and NMISS Functions in PROC SQL. In this article,
Author
The most common way to read observations from a SAS data set into SAS/IML matrices is to read all of the data at once by using the ALL clause in the READ statement. However, the READ statement also has options that do not require holding all of the observations in
In last week's article on how to create a funnel plot in SAS, I wrote the following comment: I have not adjusted the control limits for multiple comparisons. I am doing nine comparisons of individual means to the overall mean, but the limits are based on the assumption that I'm
The log transformation is one of the most useful transformations in data analysis. It is used as a transformation to normality and as a variance stabilizing transformation. A log transformation is often used as part of exploratory data analysis in order to visualize (and later model) data that ranges over
One of the advantages of programming in the SAS/IML language is its ability to transform data vectors with a single statement. For example, in data analysis, the log and square-root functions are often used to transform data so that the transformed data have approximate normality. The following SAS/IML statements create
Last week I showed how to create a funnel plot in SAS. A funnel plot enables you to compare the mean values (or rates, or proportions) of many groups to some other value. The group means are often compared to the overall mean, but they could also be compared to
Last week I presented the GSR algorithm, a statistical model of a riffle shuffle. In the model, a deck of n cards is split into two parts according to the binomial distribution. Each piece has roughly n/2 cards. Then cards are dropped from the two stacks according to the number
In a previous post, I showed how to read data from a SAS data set into SAS/IML matrices or vectors. This article shows the converse: how to use the CREATE, APPEND, and CLOSE statements to create a SAS data set from data stored in a matrix or in vectors. Creating
In a previous blog post, I showed how you can use simulation to construct confidence intervals for ranks. This idea (from a paper by E. Marshall and D. Spiegelhalter), enables you to display a graph that compares the performance of several institutions, where "institutions" can mean schools, companies, airlines, or
I recently returned from a five-day conference in Las Vegas. On the way there, I finally had time to read a classic statistical paper: Bayer and Diaconis (1992) describes how many shuffles are needed to randomize a deck of cards. Their famous result that it takes seven shuffles to randomize