A reader asked whether it is possible to find a bootstrap sample that has some desirable properties. I am using the term "bootstrap sample" to refer to the result of randomly resampling with replacement from a data set. Specifically, he wanted to find a bootstrap sample that has a specific value of the mean and standard deviation. If not, can we find a bootstrap sample whose mean and standard deviation are close to the target value? It's an interesting question. Each bootstrap sample is composed of the original observations, but because it is a sample with replacement, some observations can appear more often than others.
For very small values of N, you can solve the reader's problem by generating all bootstrap samples. In a previous article, I used the data {-1, -0.1, -0.6, 0, 0.5, 0.8, 4}, which has the sample mean 0.51 for N=7. I mentioned that one possible bootstrap sample is {4, 4, 4, 4, 0.5, 4, 4}, which has the mean 3.5. This bootstrap sample contains only large values in the original data. The mean of that sample is much greater than the mean of the original data, and the standard deviation is much less.
Of course, generating all bootstrap samples is impractical for even moderate values of N. Furthermore, bootstrap samples like this are improbable if the probability of choosing each observation is 1/N. But what if you assign a higher probability to select some observations and a lesser probability to others? For example, the sample that has six 4s is not improbable if the probability of choosing the 4 is 0.9. If you sample with unequal probability (and still with replacement) the statistics in the samples might be very different from the statistics in the original data.
This kind of sampling is no longer classical bootstrap sampling. It could be considered a kind of importance sampling. Whatever you call it, each sample you generate is a resampling from the original data, but you can control the kinds of samples that you generate by adjusting the probability of selecting each observation.
Sampling with non-uniform probability
Recall that there are four main ways to sample. You can sample with or without replacement; you can sample with equal or unequal probability. In this article, we use sampling with replacement with unequal probability. SAS supports several ways to sample with replacement and with unequal probability. This article uses PROC SURVEYSELECT with the METHOD=PPS_WR option. The acronym PPS_WR stands for "probability proportional to size (PPS), with replacement."
To illustrate sampling with unequal probability, consider the following data with N=1000 that are simulated from a uniform distribution on [0, 20]:
%let N = 1000; /* sample size */ data Have; call streaminit(54321); do i = 1 to &N; x = round( rand("uniform", 0, 20), 0.01); /* round to nearest 0.01 */ output; end; run; /* compute samples mean and std dev of original data */ proc means data=Have mean std min max; var x; run; |
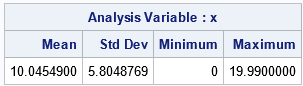
The mean and standard deviation of the data are 10.04 and 5.80, respectively. If you were to perform the usual bootstrap sampling, which selects each observation with equal probability, then most samples would have a mean in the interval [9.5, 10.5] and a standard deviation in the interval [5.6, 6.0].
Suppose you are seeking a resample that has unusual properties, such as Mean=9 and StdDev=3. It would be highly unusual to obtain these statistics by using the usual method of resampling observations with equal probability. However, you can assign a high probability to observations whose values are near the value 9. The following DATA step uses the normal density function for the N(9,3) distribution to assign the probability of selecting an observation:
/* Target: mean=9; SD = 3 */ %let mean = 9; %let StdDev = 3; /* Use the normal distribution to assign the probability of choosing an observation */ data Have2; set Have; Prob = pdf("Normal", x, &mean, &StdDev); run; |
You can use the METHOD=PPS_WR option to resample from the data by using this probability of selecting each observation. The following call to PROC SURVEYSELECT generates a resample of size N from the data but gives preference to observations that are closer to x=9.
/* Sample with replacement from the data, where the probability of choosing an obs is given by the lProb variable */ proc surveyselect noprint data=Have2 out=Resample method=PPS_WR seed=12345 N=&N; /* use OUTHITS option if you want N obs */ size Prob; /* specify the probability variable */ run; proc means data=Resample mean std; /* a different seed will give a different result */ var x; freq NumberHits; run; |
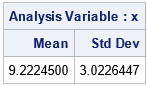
The output from PROC MEANS shows that for these uniformly distributed data, you can obtain a resample whose mean and standard deviations are close to the target values. Of course, using a different random number seed will result in a different resample and different statistics.
You can create a graph to visualize the observations that were chosen for this resample. The following graph plots the NumberHits variable, which records the number of times that each observation appears in the sample:
title "Number of Times Each Observation Appears in Resample"; proc sgplot data=Resample; scatter x=x y=NumberHits / markerattrs=(symbol=CircleFilled) transparency=0.75; xaxis values=(0 to 20 by 2); yaxis values=(1 to 8) valueshint; run; |
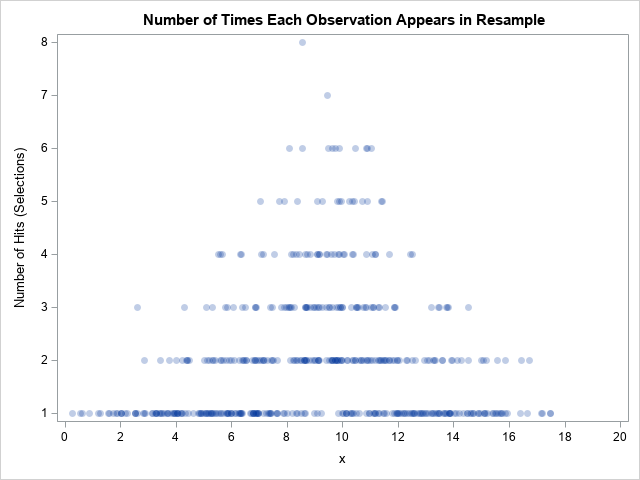
You can see that no observations for which x ≥ 18 were selected. Observations for which x ≈ 9 are selected more often than observations for which x is far from 9.
Random samples whose statistics are close to target values
If you change the random number seed, you will get a different resample that has different statistics. If you repeat this process many times, you can choose the resample whose statistics are closest to the target values. You can add the REPS= option to PROC SURVEYSELECT to generate additional resamples. This creates a variable (Replicate) that you can use as a BY-group variable in PROC MEANS. For each (Mean, StdDev) pair, you can compute a distance to the target value. You can then sort the statistics and identify the resamples whose statistics are closest to the target, as follows:
proc surveyselect noprint data=Have2 out=Resample100 method=PPS_WR Reps=100 seed=12345 N=&N; /* use OUTHITS option if you want N obs */ size Prob; /* specify the probability variable */ run; /* Compute mean and StdDev of each resample */ proc means data=Resample100 mean std noprint; by Replicate; var x; freq NumberHits; output out=BootMeans mean=Mean stddev=StdDev; run; /* compute distance from statistics to target values */ data Diff; set BootMeans; DiffMean = &Mean - Mean; DiffStd = &StdDev - StdDev; EuclidDist = euclid(DiffMean, DiffStd); /* distance between observation and a target value */ run; proc sort data=Diff; by EuclidDist; /* sort by how close statistics are to target values */ run; proc print data=Diff(obs=5); var Replicate Mean StdDev DiffMean DiffStd EuclidDist; run; |
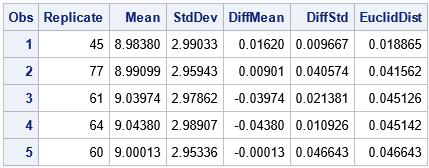
The top five resamples (from 100) are shown. For these resamples, the mean is close to 9 and the standard deviation is close to 3, which are the target values. If you measure "closeness" by using a Euclidean distance, then Replicate=45 is the resample whose statistics are closest to the target values.
Why the example works
It is possible to turn this example into a general-purpose method for finding a resample that has statistics that are close to target values. However, it requires some additional work. I will outline why this example works and what is required to generalize the example.
Let f(x) be the probability density function of the data. If you sample uniformly from the distribution, then \(E(X) = \int x f(x)\, dx\) is the expected value of the distribution. The classical bootstrap method generates samples for which the expected sample mean is E(X). However, if you sample according to some other probability distribution, g(x), then the expected value of the sample is \(\int x f(x) g(x)\, dx\). By strategically choosing g(x), you can control the expected value. The same is true for higher-order moments, such as the variance.
For this example, the data has a uniform density, so it was easy to choose a value for g(x) so that the expected mean and variance matches target values. For data that has a non-uniform density, the process is more complicated because you must consider the convolution of f(x) and g(x).
Even for this example, you might not be able to match every set of target values. For example, you probably can't find a resample that has a large mean and also a large variance.
Summary
This article considers whether it is possible to find a resample that has a desired set of statistics. A classical bootstrap sample selects observations with replacement and with uniform probability. With high probability, the bootstrap sample has statistical properties that are somewhat similar to the original data. However, if you sample with nonuniform probability, you can obtain resamples whose statistical properties are quite different from the original data. The article uses the METHOD=PPS_WR option in PROC SURVEYSELECT to create an example in the special case where the data are uniformly distributed.

2 Comments
Very interesting, but what if I want to start with a normal dist and end with a uniform dist?
That's easy: use the CDF to transform the random sample into the interval (0,1). This works for any initial distribution, not just the normal distribution.