A common question on discussion forums is how to compute a principal component regression in SAS. One reason people give for wanting to run a principal component regression is that the explanatory variables in the model are highly correlated which each other, a condition known as multicollinearity. Although principal component regression (PCR) is a popular technique for dealing with almost collinear data, PCR is not a cure-all. This article shows how to compute a principal component regression in SAS; a subsequent article discusses the problems with PCR and presents alternative techniques.
Multicollinearity in regression
Near collinearity among the explanatory variables in a regression model requires special handling because:
- The crossproduct matrix X`X is ill-conditioned (nearly singular), where X is the data matrix.
- The standard errors of the parameter estimates are very large. The variance inflation factor (VIF), which is computed by PROC REG, is one way to measure how collinearities inflate the variances of the parameter estimates.
- The model parameters are highly correlated, which makes interpretation of the parameters difficult.
Principal component regression keeps only the most important principal components and discards the others. This means that you compute the principal components for the explanatory variables and drop the components that correspond to the smallest eigenvalues of X`X. If you keep k principal components, then those components enable you to form a rank-k approximation to the crossproduct matrix. If you regress the response variable onto those k components, you obtain a PCR. Usually the parameter estimates are expressed in terms of the original variables, rather than in terms of the principal components.
In SAS there are two easy ways to compute principal component regression:
- The PLS procedure supports the METHOD=PCR to perform principal component regression. You can use the NFAC= option to determine the number of principal components to keep.
- The MODEL statement in PROC REG supports the PCOMIT= option. (This option is read as "PC omit.") The argument to the PCOMIT= option is the number of principal components to drop (omit) from the regression.
Notice that neither of these methods calls PROC PRINCOMP. You could call PROC PRINCOMP, but it would be more complicated than the previous methods. You would have to extract the first principal components (PCs), then use PROC REG to compute the regression coefficients for the PCs, then use matrix computations to convert the parameter estimates from the PCs to the original variables.
Principal component regression is also sometimes used for general dimension reduction. Instead of projecting the response variable onto a p-dimensional space of raw variables, PCR projects the response onto a k-dimensional space where k is less than p. For dimension reduction, you might want to consider another approach such as variable selection by using PROC GLMSELECT or PROC HPGENSELECT. The reason is that the PCR model retains all of the original variables whereas variable selection procedures result in models that have fewer variables.
Use PROC PLS for principal component regression
I recommend using the PLS procedure to compute a principal component regression in SAS. As mentioned previously, you need to use the METHOD=PCR and NFAC= options. The following data for 31 men at a fitness center is from the documentation for PROC REG. The goal of the study is to predict oxygen consumption from age, weight, and various physiological measurements before and during exercise. The following call to PROC PLS computes a PCR that keeps four principal components:
data fitness; input Age Weight Oxygen RunTime RestPulse RunPulse MaxPulse @@; datalines; 44 89.47 44.609 11.37 62 178 182 40 75.07 45.313 10.07 62 185 185 44 85.84 54.297 8.65 45 156 168 42 68.15 59.571 8.17 40 166 172 38 89.02 49.874 9.22 55 178 180 47 77.45 44.811 11.63 58 176 176 40 75.98 45.681 11.95 70 176 180 43 81.19 49.091 10.85 64 162 170 44 81.42 39.442 13.08 63 174 176 38 81.87 60.055 8.63 48 170 186 44 73.03 50.541 10.13 45 168 168 45 87.66 37.388 14.03 56 186 192 45 66.45 44.754 11.12 51 176 176 47 79.15 47.273 10.60 47 162 164 54 83.12 51.855 10.33 50 166 170 49 81.42 49.156 8.95 44 180 185 51 69.63 40.836 10.95 57 168 172 51 77.91 46.672 10.00 48 162 168 48 91.63 46.774 10.25 48 162 164 49 73.37 50.388 10.08 67 168 168 57 73.37 39.407 12.63 58 174 176 54 79.38 46.080 11.17 62 156 165 52 76.32 45.441 9.63 48 164 166 50 70.87 54.625 8.92 48 146 155 51 67.25 45.118 11.08 48 172 172 54 91.63 39.203 12.88 44 168 172 51 73.71 45.790 10.47 59 186 188 57 59.08 50.545 9.93 49 148 155 49 76.32 48.673 9.40 56 186 188 48 61.24 47.920 11.50 52 170 176 52 82.78 47.467 10.50 53 170 172 ; proc pls data=fitness method=PCR nfac=4; /* PCR onto 4 factors */ model Oxygen=Age Weight RunTime RunPulse RestPulse MaxPulse / solution; run; |
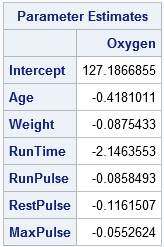
The output includes the parameter estimates table, which gives the estimates for the four-component regression in terms of the original variables. Another table (not shown) shows that the first four principal components explain 93% of the variation in the explanatory variables and 78% of the variation in the response variable.
For another example of using PROC PLS to combat collinearity, see Yu (2011), "Principal Component Regression as a Countermeasure against Collinearity."
Use PROC REG for principal component regression
I recommend PROC PLS for principal component regression, but you can also compute a PCR by using the PCOMIT= option on the MODEL statement in PROC REG. However, the parameter estimates are not displayed in any table but must be written to OUTEST= data set, as follows:
proc reg data=fitness plots=none outest=PE; /* write PCR estimates to PE data set */ model Oxygen=Age Weight RunTime RunPulse RestPulse MaxPulse / PCOmit=2; /* omit 2 PCs ==> keep 6-2=4 PCs */ quit; proc print data=PE(where=(_Type_="IPC")) noobs; var Intercept--MaxPulse; run; |
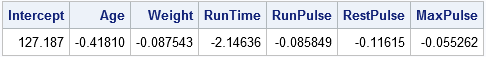
Notice that the PCOMIT=2 option specifies that two PCs should be dropped, which is equivalent to keeping four components in this six-variable model. The parameter estimates are written to the PE data set and are displayed by PROC PRINT. The estimates the same as those found by PROC PLS. In the PE data, the PCR estimates are indicated by the value "IPC" for the _TYPE_ variable, which stands for incomplete principal component regression. The word "incomplete" indicates that not all the principal components are used.
It is worth noting that even though the principal components themselves are based on centered and scaled data, the parameter estimates are reported for the original (raw) variables. It is also worth noting that you can use the OUTSEB option on the PROC REG statement to obtain standard errors for the parameter estimates.
Should you use principal component regression?
This article shows you how to perform principal component regression in SAS by using PROC PLS with METHOD=PCR. However, I must point out that there are statistical drawbacks to using principal component regression. The primary issue is that principal component regression does not use any information about the response variable when choosing the principal components. Before you decide to use PCR, I urge you to read my next post about the drawbacks with the technique. You can then make an informed decision about whether you want to use principal component regression for your data.

6 Comments
Rick,
Thanks for the clear introduction about PCR. I have two questions:
First, in either SAS procedure for PCR, could we conduct the 95% confidence intervals of the transformed estimated coefficients?
Second, theoretically, the number of principal components is fewer than the number of original variables. Thus, when converting the estimated coefficients of principal components, the matrix rank is no longer full rank, so how come can the estimated coefficients of principal components be converted to the estimated coefficients of original variables?
As long as the original data are not rank-deficient, there is an invertible linear transformation between the original basis and the (full) orthogonal PCA basis. If you know the variances of the estimates and the covariance of the betas, you can push that information forward to compute the variances of the estimates for the PCA coefficients. See the explanation by whuber on StackExchange that begins "I've been thinking about this..."
Dear Dr. Wicklin,
I tried using PROC PLS to accomplish principal component regression, I found that the standard error corresponding to parameter estimate was not presented by the programme. What measures should we take to make the programme present the standard error of parameter estimate. Thank you very much for your help.
PLS-regression coefficients do not have confidence intervals in the traditional statistical sense
(Wold, et al. (2001) "PLS-regression: a basic tool of chemometrics," p. 114), so PROC PLS does not have an option for CLB.
For PCR, you can get the CLB by writing the PCs to a data set. Then use them as explanatory variables in PROC REG. The CLB option on the MODEL stmt will give the confidence limits for the coefficients of the PCs.
Dear Dr. Wicklin,
Thank you very much for your prompt and helpful reply about principal component regression. I hereby have a request. That is, would you please provide an example of SAS codes invoking both the 'PROC REG' and the 'CLB option on the MODEL stmt' to complete principal component regression and estimate of confidence interval. Thanks a lot!
If you do not know how to write the SAS code, you can ask questions at the SAS Support Communities. That forum makes it easy to share code.