A common question on SAS discussion forums is how to compute the minimum and maximum values across several variables. It is easy to compute statistics across rows by using the DATA step. This article shows how to compute the minimum and maximum values for each observation (across variables) and, for completeness, for each variable. If you think of your numerical data as being in a matrix, the task is to compute the minimum and maximum values for each row or for each column. You can do this in Base SAS or by using a powerful subscript operator in the SAS/IML matrix language.
The data in this article are Fisher's famous iris data, which contains the widths and lengths of the petals and sepals of 150 iris flowers. This data is distributed in the Sashelp.Iris data set as part of SAS software.
The minimum and maximum values of variables: Base SAS
The MEANS procedure is the simplest way to compute the minimum and maximum values for each numeric variable in a data set. The following statements display the extreme values for the four numerical variables in the iris data:proc means nolabels data=Sashelp.Iris Min Max; output out=MinMaxCols; run; |
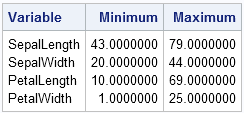
By not specifying the VAR statement, all numeric variables are used. (You could also specify var _numeric_;) The OUTPUT statement writes the minimum an maximum values to the MinMaxCols data set, along with a few other useful statistics.
The minimum and maximum values of observations: Base SAS
The SAS DATA step contains the MIN and MAX functions, which return the minimum and maximum nonmissing values (respectively) from a list of variables. You can read all of the numerical variables in a data set into an array and call the MIN and MAX functions as follows:
data MinMaxRows; set sashelp.Iris; array x {*} _numeric_; /* x[1] is 1st var,...,x[4] is 4th var */ min = min(of x[*]); /* min value for this observation */ max = max(of x[*]); /* max value for this observation */ run; proc print data=MinMaxRows(obs=7); var _numeric_; run; |
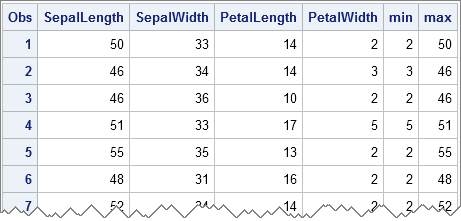
You can see that the MIN variable contain the minimum value of each row and the MAX variable contains the maximum value. Notice that you can use the _NUMERIC_ keyword to automatically assign the contents of the array x. This DATA step will work for any input data that contains numeric variables because the variable names are not hard-coded!
Also note that you can use the OF operator (sometimes called the OF keyword) to specify that the MIN and MAX functions should operate across all elements in the array.
The minimum and maximum values of columns in a matrix
The SAS/IML language contains a number of operators (called subscript reduction operators) that you can use to perform simples statistical operations down matrix columns or across matrix rows. This makes it easy to compute the maximum value of each row or column, and similarly for the minimum value.
The important operators are the max subscript operator (<>) and the min subscript operator (><). You use these operators like subscripts. To find extrema for columns, use these operators in place of row subscripts, as follows:
proc iml;
use Sashelp.Iris;
read all var _NUM_ into X[c=varNames];
close Sashelp.Iris;
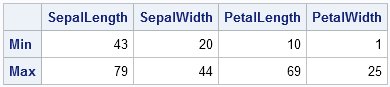
minC = X[><, ]; /* row vector contains min of columns */
maxC = X[<>, ]; /* row vector contains max of columns */
print (minC//maxC)[r={"Min" "Max"} c=varNames]; |
For years I struggled to remember which combination of greater-than and less-than symbols was the min operator and which was the max operator. Eventually I developed the following mental image. Think of the minimum as being the bottom of a valley. If you are viewing a valley from the far side of a lake, the image looks like a greater-than sign placed next to a less-than sign. Similarly, think of a maximum as being the peak of a mountain. If you are viewing the mountain from across a lake, the image looks like a less-than sign placed next to a great-than sign. These mnemonic aids are shown in the following image:

The minimum and maximum values of rows in a matrix
In a similar way, you can compute the minimum and maximum values of each row of a matrix, as follows:
minR = X[ ,><]; /* column vector contains min of rows */ maxR = X[ ,<>]; /* column vector contains max of rows */ |
The MinR and MaxR vectors each contain 150 elements. The value MinR[i]is the minimum value of the ith row and the value MaxR[i]is the maximum value of the ith row.
One of the nice aspects of the SAS/IML matrix language is its symmetry: operations on rows and operations on columns are often closely related to each other. This is in contrast to Base SAS, where the DATA step is often the best choice for computing statistics for observations, whereas procedures are often easier to use for computing statistics for variables.

16 Comments
Pingback: Elementwise minimum and maximum operators - The DO Loop
I like this blog. It's very helpful!
Pingback: Compute nearest neighbors in SAS - The DO Loop
Pingback: Random segments and broken sticks - The DO Loop
What if there are two columns having same values and both are either maximum or minimum? Which columns does it take then?
The one with the smallest index. So if the 5th and 7th have the same value, it will return 5.
hi i am looking for a data step (no Proc step) to find the minimum and maximum value of the age variable in only two observation Min and Max.
name age height weight Sex
vikas 12 140 55 M
sachin 15 155 48 M
Chotu 18 145 57 M
Karuna 26 142 46 F
Sweety 23 144 52 F
shobhit 32 158 28 M
Hi,
Please advise.
I am doing certain data manipulations in SAS Arrays but I am getting missing results for z_xyz_m[i+1] arrays. This is happening inside a loop for i=1to36; Can we use Min/Max/Log functions like below?
z_xyz_m[i+1] = min(max(xyz_m[i+1],0.3),1.3);
z_appr_m[i+1] = log(min(max(appr_m[i+1],0.3),1.5));
Any feedback will be helpful.
I suggest you ask your questions at the SAS Support Communities. Include details and the code you are currently using.
For the sake of comprehensiveness, here is a more complete list of supported data step syntaxes, which don't all yield the same result.
data t;
A=-1;
B=. ;
C1= A min B;
C2= A max B;
D1= A >< B;
D2= A <> B;
E1=smallest(1,A,B);
E2=largest (1,A,B);
F1=min(1,A,B);
F2=max(1,A,B);
run;
The last two statements should be MIN(A,B) and MAX(A,B). The discrepancies you observe are because some operators and functions exclude missing values whereas others include missing values and treat them as the "most negative" floating point value.
thank you it really helpful!!
Pingback: 6 easy ways to specify a list of variables in SAS - The DO Loop
hai please asvise me a way to solve this
data patients;
input id sex $ age country $ trt $ dose;
datalines;
101 MALE 22 INDIA FABIFLU 200
102 FEMALE 21 USA FABIFLU 300
103 FEMALE 18 INDIA RAMIFLU 200
104 MALE 28 USA FABIFLU 200
105 FEMALE 32 USA FABIFLU 300
106 MALE 24 CANADA RAMIFLU 300
107 MALE 35 CANADA RAMIFLU 200
108 MALE 38 USA FABIFLU 200
109 FEMALE 22 CANADA FABIFLU 300
110 FEMALE 19 INDIA FABIFLU 200
111 MALE 18 INDIA FABIFLU 300
112 FEMALE 22 INDIA RAMIFLU 200
113 MALE 39 USA FABIFLU 300
114 FEMALE 29 CANADA RAMIFLU 200
115 FEMALE 32 CANADA RAMIFLU 200
116 MALE 29 USA FABIFLU 200
117 MALE 18 USA FABIFLU 300
118 FEMALE 23 INDIA RAMIFLU 300
119 MALE 33 CANADA RAMIFLU 200
120 FEMALE 35 USA FABIFLU 300
;
run;
its my dataset and i want to know ...which id has the highest age that i want to get the id number whose age is highest age of them
Happy to help. Post your question to the SAS Support Communities, and you will get multiple responses showing different ways. My favorite is use PROC UNIVARIATE, but you can also use PROC SQL or the DATA step. If you have a preference, mention it when you post your questions.
Pingback: The name of the variable that contains the largest value in each row - The DO Loop