A classical problem in elementary probability asks for the expected lengths of line segments that result from randomly selecting k points along a segment of unit length. It is both fun and instructive to simulate such problems. This article uses simulation in the SAS/IML language to estimate solutions to the following problems:
- Randomly choose a point at random in the interval (0, 1). The point divides the interval into two segments of length x and 1-x. What is the expected length of the larger (smaller) segment?
- Randomly choose k points at random in the interval (0, 1). The points divide the interval into k+1 segments. What is the expected length of the largest (smallest) segment?
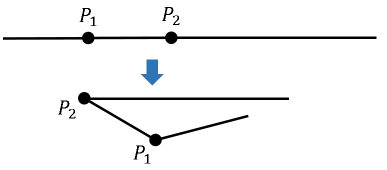
- When k=2, the points divide the interval into three segments. What is the probability that the three segments can form a triangle? This is called the broken-stick problem and is illustrated in the figure to the right.
You can find a discussion and solution to these problems on many websites, but I like the Cut-The-Knot.org website, which includes proofs and interactive Java applets.
Simulate a solution in SAS
You can simulate these problems in SAS by writing a DATA step or a SAS/IML program. I discuss the DATA step at the end of this article. The body of this article presents a SAS/IML simulation and constructed helper modules that solve the general problem. The simulation will do the following:
- Generate k points uniformly at random in the interval (0, 1). For convenience, sort the points in increasing order.
- Compute the lengths of the k+1 segments.
- Find the length of the largest and smallest segments.
In many languages (including the SAS DATA step), you would write a loop that performs these operations for each random sample. You would then estimate the expected length by computing the mean value of the largest segment for each sample. However, in the SAS/IML language, you can use matrices instead of using a loop. Each sample of random points can be held in the column of a matrix. The lengths of the segments can also be held in a matrix. The largest segment for each trial is stored in a row vector.
The following SAS/IML modules help solve the general simulation problem for k random points. Because the points are ordered, the lengths of the segments are the differences between adjacent rows. You can use the DIF function for this computation, but the following program uses the DifOp module to construct a small difference operator, and it uses matrix multiplication to compute the differences.
proc iml; /* Independently sort column in a matrix. See https://blogs.sas.com/content/iml/2011/03/14/sorting-rows-of-a-matrix.html */ start SortCols(A); do i = 1 to ncol(A); v = A[ ,i]; call sort(v); A[ ,i] = v; /* get i_th col and sort it */ end; finish; /* Generate a random (k x NSim) matrix of points, then sort each column. */ start GenPts(k, NSim); x = j(k, NSim); /* allocate k x NSim matrix */ call randgen(x, "Uniform"); /* fill with random uniform in (0,1) */ if k > 1 then run SortCols(x); return x; finish; /* Return matrix for difference operator. See https://blogs.sas.com/content/iml/2017/07/24/difference-operators-matrices.html */ start DifOp(dim); D = j(dim-1, dim, 0); /* allocate zero matrix */ n = nrow(D); m = ncol(D); D[do(1,n*m, m+1)] = -1; /* assign -1 to diagonal elements */ D[do(2,n*m, m+1)] = 1; /* assign +1 to super-diagonal elements */ return D; finish; /* Find lengths of segments formed by k points in the columns of x. Assume each column of x is sorted and all points are in (0,1). */ start SegLengths(x); /* append 0 and 1 to top and bottom (respectively) of each column */ P = j(1, ncol(x), 0) // x // j(1, ncol(x), 1); D = DifOp(nrow(P)); /* construct difference operator */ return D*P; /* use difference operator to find lengths */ finish; P = {0.1 0.2 0.3, 0.3 0.8 0.5, 0.7 0.9 0.8 }; L = SegLengths(P); print L[label="Length (k=3)"]; |
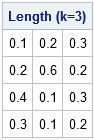
The table shows the lengths of three different sets of points for k=3. The first column of P corresponds to points at locations {0.1, 0.3, 0.7}. These three points divide the interval [0, 1] into four segments of lengths 0.1, 0.2, 0.4, and 0.3. Similar computations hold for the other columns.
The expected length of the longer of two segments
For k=1, the problem generates a random point in (0, 1) and asks for the expected length of the longer segment. Obviously the expected length is greater than 1/2, and you can read the Cut-The-Knot website to find a proof that shows that the expected length is 3/4 = 0.75.
The following SAS/IML statements generate one million random points and compute the larger of the segment lengths. The average value of the larger segments is computed and is very close to the expected value:
call randseed(54321); k = 1; NSim = 1E6; x = GenPts(k, NSim); /* simulations of 1 point dropped onto (0,1) */ L = SegLengths(x); /* lengths of segments */ Largest = L[<>, ]; /* max length among the segments */ mean = mean(Largest`); /* average of the max lengths */ print mean; |

You might not be familiar with the SAS/IML max subscript operator (<>) and the min subscript operator (><). These operators compute the minimum or maximum values for each row or column in a matrix.
The expected length of the longest of three segments
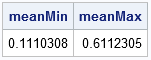
For k=2, the problem generates two random points in (0, 1) and asks for the expected length of the longest segment. You can also ask for the average shortest length. The Cut-The-Knot website shows that the expected length for the longest segment is 11/18 = 0.611, whereas the expected length of the shortest segment is 2/18 = 0.111.
The following SAS/IML statements simulate choosing two random points on one million unit intervals. The program computes the one million lengths for the resulting longest and shortest segments. Again, the average values of the segments are very close to the expected values:
k = 2; NSim = 1E6; x = GenPts(k, NSim); /* simulations of 2 points dropped onto (0,1) */ L = SegLengths(x); /* lengths of segments */ maxL = L[<>, ]; /* max length among the segments */ meanMax = mean(maxL`); /* average of the max lengths */ minL = L[><, ]; /* min length among the segments */ meanMin = mean(minL`); /* average of the max lengths */ print meanMin meanMax; |
The broken stick problem
You can use the previous simulation to estimate the broken stick probability. Recall that three line segments can form a triangle provided that they satisfy the triangle inequality: the sum of the two smaller lengths must be greater than the third length. If you randomly choose two points in (0,1), the probability that the resulting three segments can form a triangle is 1/4, which is smaller than what most people would guess.
The vectors maxL and minL each contain one million lengths, so it is trivial to compute the vector of that contains the third lengths.
/* what proportion of randomly broken sticks form triangles? */ medL = 1 - maxL - minL; /* compute middle length */ isTriangle = (maxL <= minL + medL); /* do lengths satisfy triangle inequality? */ prop = mean(isTriangle`); /* proportion of segments that form a triangle */ print prop; |

As expected, about 0.25 of the simulations resulted in segments that satisfy the triangle inequality.
In conclusion, this article shows how to use the SAS/IML language to solve several classical problems in probability. By using matrices, you can run the simulation by using vectorized computations such as matrix multiplication finding the minimum or maximum values of columns. (However, I had to use a loop to sort the points. Bummer!)
If you want to try this simulation yourself in the DATA step, I suggest that you transpose the SAS/IML setup. Use arrays to hold the random points and use the CALL SORTN subroutine to sort the points. Use the LARGEST function and the SMALLEST function to compute the largest and smallest elements in an array. Feel free to post your solution (and any other thoughts) in the comments.

1 Comment
Pingback: Dimension reduction: Guidelines for retaining principal components - The DO Loop