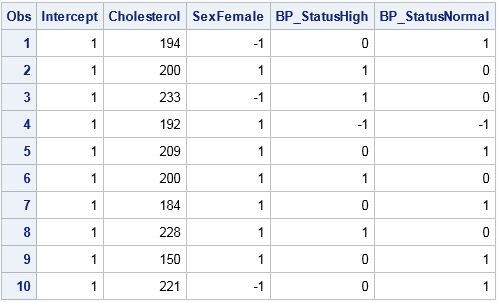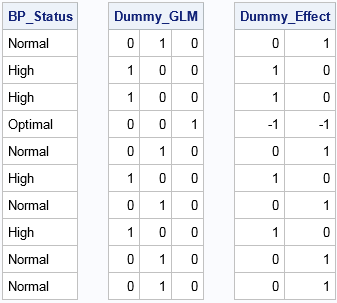
Last week I showed how to create dummy variables in SAS by using the GLMMOD procedure. The procedure enables you to create design matrices that encode continuous variables, categorical variables, and their interactions. You can use dummy variables to replace categorical variables in procedures that do not support a CLASS

