I've often wondered about the logic that the SGPLOT procedure in SAS uses to determine whether a set of graphical overlays will receive identical attributes or different attributes. (Recall that color, size, line style, and marker symbol are all examples of attributes.) I know that when you plot grouped data ("long-form" data by using the GROUP= option), each component of the plot gets a unique attributes by default. The situation is less clear when you are plotting wide data (multiple variables) by using multiple statements. From experience, I noticed that usually the overlaid plots have the same attributes, but there seemed to be situations when they are assigned different attributes.
Recently, I figured out a source of my confusion: the default behavior changes depending on whether the plots in the overlay are of different types or the same type:
- If the plots in the overlay are the same type (for example, all SERIES statements), the attributes of the plots are displayed by using distinct attributes. For example, in many ODS styles, four SERIES statements will result in four lines that have different colors.
- If the plots in the overlay are different types (for example, a SERIES statement and a SCATTER statement), the attributes of the plots are the same. For example, four SERIES statements and one SCATTER statement will result in all lines and markers being the same color.
The CYCLEATTRS option
First, recall that the CYCLEATTRS (or NOCYCLEATTERS) option affects how attributes change when you use two or more plot statements. A previous article suggests a useful mnemonic device: the word "CYCLE" begins with an "S" sound, as does the word "statements." Say the following sentence out loud, emphasizing the common "S" sounds: "CYCLEATTRS affect Statements."
I had wrongly assumed that PROC SGPLOT uses the CYCLEATTRS option as the default in all situations. As I explained in the previous section, that assumption is wrong. The default option is CYCLEATTRS when the plots in an overlay are the same type. Otherwise, the default option is NOCYCLEATTRS. Regardless of the types, you can use the CYCLEATTRS or NOCYCLEATTRS to force the procedure to use whichever option you want. The following sections provide examples.
Example 1: All plots are the same type
Remember, the example in this article all refer to plotting "wide data." In wide data, you use multiple statements to plot multiple variables. The following DATA step creates the graphs of the exponential function and three Taylor polynomials. The call to PROC SGPLOT uses four SERIES statements.
ods graphics / attrpriority=color; /* many modern styles use attrpriority=color */ data Functions; do x = -2 to 2 by 0.05; Function = exp(x); /* exp(x) = 1 + x + x^2/2! + x^3/3! + ... */ Linear = 1 + x; Quadratic = Linear + x**2 / 2; Cubic = Quadratic + x**3 / 6; output; end; run; title "Automatic Cycling of Attributes"; title2 "attrpriority=color"; proc sgplot data=Functions noautolegend; /* CYCLEATTRS is default if all statements are the same */ series x=x y=Function / curvelabel="exp(x)"; series x=x y=Linear / curvelabel; series x=x y=Quadratic / curvelabel; series x=x y=Cubic / curvelabel; xaxis grid; yaxis grid max=6; run; |
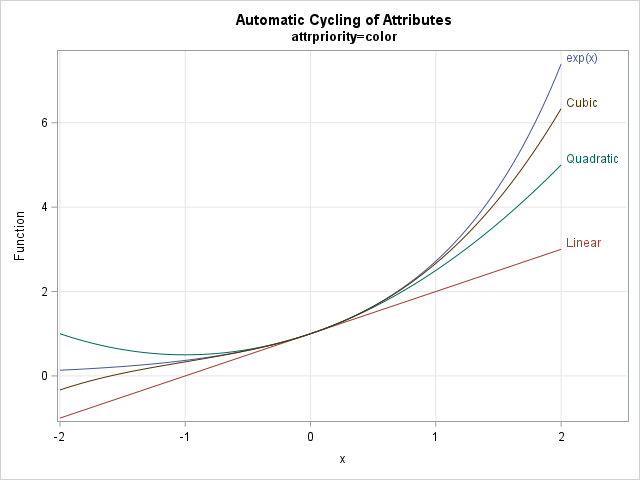
In this example, all plot statements are SERIES statements, so the CYCLEATTRS option is used to assign attributes. In this example, each plot gets the attributes from the GraphDataDefault style element in the current style. The attribute for the first curve is GraphData1, the second curve uses GraphData2, and so forth.
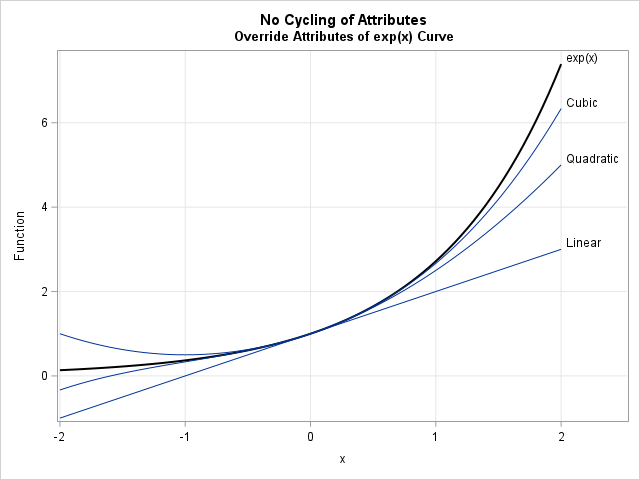
You can use the LINEATTRS= option on any SERIES statement to override the attributes of a specific curve. You can also explicitly use the NOCYCLEATTRS option on the PROC SGPLOT statement to override the cycling of attributes. For example, the following call to PROC SGPLOT uses the NOCYCLEATTRS option, which means that all lines will be drawn by using the GraphData1 properties, which is a solid blue line in my ODS style. However, I use the LINEATTRS= option to set the first line to be thick and black.
/* do not cycle the attributes; manually set the attributes of the first curve */ title "No Cycling of Attributes"; title2 "Override Attributes of exp(x) Curve"; proc sgplot data=Functions noautolegend nocycleattrs; series x=x y=Function / curvelabel="exp(x)" lineattrs=(color=black thickness=2); series x=x y=Linear / curvelabel; series x=x y=Quadratic / curvelabel; series x=x y=Cubic / curvelabel; xaxis grid; yaxis grid max=6; run; |
Example 2: At least two plot types
Suppose you want to use a marker to represent the origin, which is the point (0,0). The following DATA step creates new variables (PX and PY) and assigns the value 0 to each. The new variables are merged with the previous data. The call to PROC SGPLOT uses the previous four SERIES statements, but now includes a SCATTER statement, which displays a marker at (0,0). As discussed above, because you are overlaying plots of DIFFERENT types (SERIES and SCATTER), the procedure will use the NOCYCLEATTRS option, as follows:
/* what happens if you overlay a different plot, such as a scatter plot? */ data Origin; px = 0; py = exp(px); run; data PolyOrigin; set Functions Origin; run; title "Overlay Series and Scatter Plot"; title2 "Default Is NOCYCLEATTRS"; proc sgplot data=PolyOrigin noautolegend; series x=x y=Function / curvelabel="exp(x)"; series x=x y=Linear / curvelabel; series x=x y=Quadratic / curvelabel; series x=x y=Cubic / curvelabel; scatter x=px y=py / ; xaxis grid label="x"; yaxis grid max=6 label="Y"; run; |
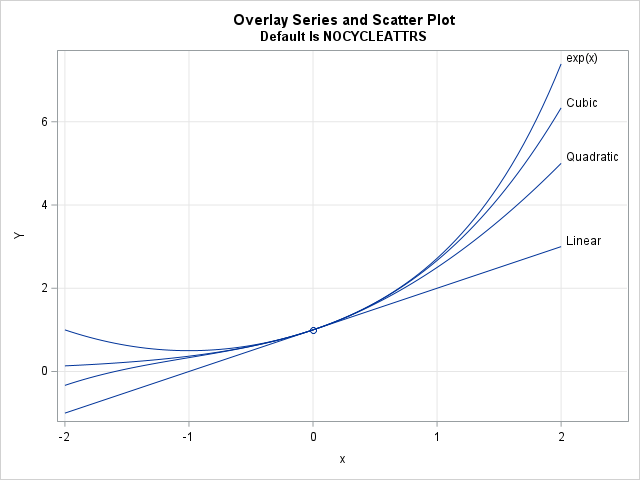
This behavior might be surprising if you don't understand when the procedure uses the CYCLEATTRS and NOCYCLEATTRS options as default. When you add the SCATTER statement, you change the default assignment of attributes.
As before, you can override individual attributes on a statement-by-statement basis. You can also use the CYCLEATTRS option to restore the previous colors for the lines, as follows:
/* explicitly turn on the CYCLEATTRS option */ title "Overlay Series and Scatter Plot: CYCLEATTRS Option"; title2 "Override Attributes of exp(x) Curve and Marker at Origin"; proc sgplot data=PolyOrigin noautolegend cycleattrs; series x=x y=Function / curvelabel="exp(x)" lineattrs=(color=black thickness=2); series x=x y=Linear / curvelabel; series x=x y=Quadratic / curvelabel; series x=x y=Cubic / curvelabel; scatter x=px y=py / markerattrs=(symbol=CircleFilled color=black); xaxis grid label="x"; yaxis grid max=6 label="Y"; run; |
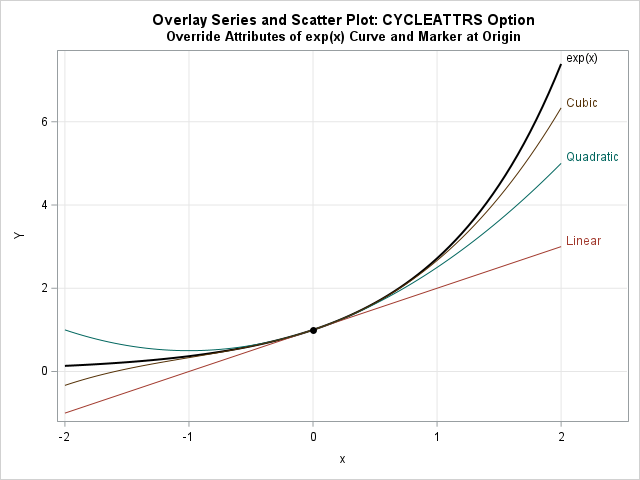
By using the CYCLEATTRS option, I only need to override the attributes of two plot elements. I sometimes see programmers explicitly set LINEATTRS= options for every SERIES statement. It is much easier to turn on the CYCLEATTRS option and let SAS assign attributes automatically.
Summary
This article discusses the fact that the plot types in a PROC SGPLOT overlay determine how attributes such as color and line style are assigned. If the plots in the overlay are the same type, the attributes of the components are distinct (by default). If the plots in the overlay are different types, the attributes of the components are the same (by default). For example, four SERIES statements will result in each curve having different attributes. Add a SCATTER statement, and suddenly all lines and markers have the same attributes. This article provides examples of this behavior and shows how to override the default by using the CYCLEATTRS or NOCYCLEATTRS options, and by overriding the attributes on a statement-by-statement basis.
References and Further Reading
The following links contain additional examples and explanations:
- The CYCLEATTRS option: The CYCLEATTRS option assigns unique attributes to each plot in the graph. The NOCYCLEATTRS option prevents the procedure from assigning unique attributes.
- Automatic Differentiation of Visual Attributes: Explains the default behavior when an overlay contains plots that are the same type or different types.
- There are interactions between the CYCLEATTRS option, the ATTRPRIORITY= global option, and the STYLEATTRS statement.

2 Comments
Rick,
data PolyOrigin;
set Polynomials Origin;
run;
Where is dataset "Polynomials " ? I did not see it in your code.
Thanks for finding that typo. It's the initial data set. I changed it from 'Polynomials' in 3 places, but I should have changed it in 4 places.