Dating can be a challenge. No, I'm not talking about the process of finding a soulmate. I'm talking about managing days, weeks, months, and years in statistical analyses and reports! One challenge is how to number the weeks of the year. Because there are seven days in a week, 52 weeks equals 7*52 = 364 days of the year. Of course, there are 365 (or 366) days in a year, so the "first week of the year" does not always start on New Year's Day. But when does it start? What date is the first day of the first week of a specified year?
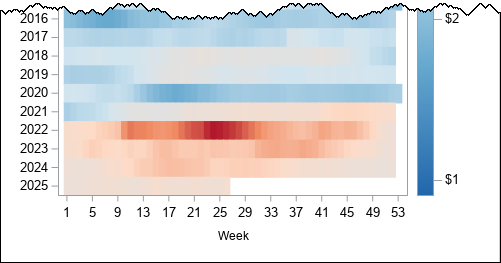
SAS provides functions that simplify the process of handling weeks within a year. They are best described by using an example. A previous article shows a visualization of weekly gas prices over several decades. The visualization uses a heat map, where the rows of the matrix represent years and the columns of the matrix represent weeks. A portion of the graph is shown the right. To make the graph, I used the WEEK function in SAS to find the week of the year for each date. This article describes how to strengthen your SAS skills by learning about the WEEK function.
The WEEK function
The WEEK function in SAS returns a week number for every date.
The ISO standard for counting weeks specifies that
a week number is in the range 1-53.
To obtain the ISO standard, use the 'V' option in the WEEK function, like this:
week_of_year = week(date, 'V');
The Appendix discusses other options for the WEEK function.
In the ISO standard, every week has seven days. Weeks begin on Monday and end on Sunday. A year contains either 365 or 366 days, which means there are 52 full weeks in a year (7*52 = 364) and a day or two "left over." To accommodate the extra days, every five or six years contains a "leap week," which is a 53rd week!
If New Year's Day is not a Monday, it isn't obvious when the first week of the new year starts. The ISO standard specifies that the first week of the year is the week that contains 04JAN. This implies that the first week of a new year can start as early as 29DEC and as late as 04JAN. The following table shows the week number for seven years. The years are chosen so that the first day of the year (01JAN) is a Sunday, a Monday, a Tuesday, and so forth. Thus, the table contains all possible configurations of weeks for the ISO standard. The first column shows the year for 01JAN; the December dates are in the previous year. Mondays are highlighted in yellow.
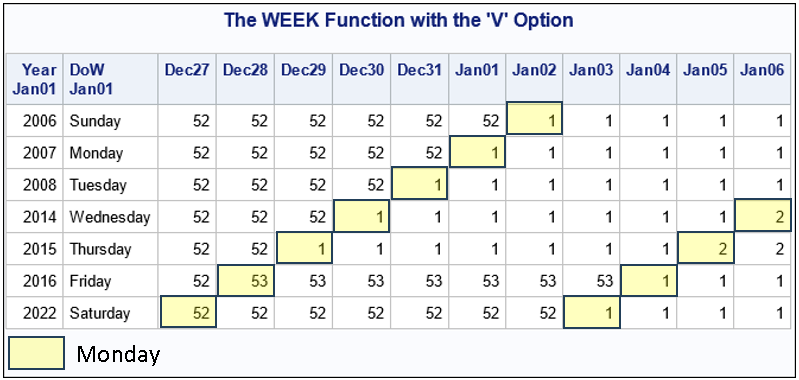
The table shows a few interesting facts:
- When 01JAN is a Monday, the preceding week (Week=52) is entirely in the previous year. The first week is entirely in the new year.
- When 01JAN is not a Monday, there is a week that contains some days in the previous year and some days in the new year. For example, when 01JAN is a Wednesday, 30DEC and 31DEC are in the same week as 01JAN-05JAN.
- When 01JAN is a Friday, the preceding year contains a "leap week," which is Week=53. The leap week contains days in the previous year and in the new year.
The table shows two important facts. First, in some years the first week of the new year (Week=1) contains days from the previous year. Similarly, in some years the last week of the previous year (Week=52 or Week=53) contains days from the new year. This means that the date's calendar year might be different than the week's year. For example:
- The dates 29DEC2014, 30DEC2014, and 31DEC2014 belong to the calendar year 2014, but they belong to the first week (Week=1) of 2015.
- The dates 01JAN2016, 02JAN2016, and 03JAN2016 belong to the calendar year 2016, but they belong to the last week (Week=53) of 2015.
Consequently, you cannot naively use the YEAR function in SAS to find out what year a week belongs to. Instead, you need to apply a little programming logic, as shown in the next section.
What year does a week belong to?
To make the heat map at the top of this article, you must know which row (year) to place each week. As discussed above, you cannot simply use the YEAR function to find the year of a date. However, you can use a little trick. For a date in the last week, use the year of the date that is seven days earlier. For a date in the first week, use the year of the date that is seven days later.
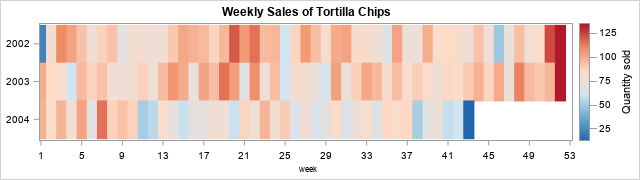
For example, let's visualize sales of snack foods in the Sashelp.Snacks data set. The data contains sales for many products, but we will restrict to Product="Tortilla chips". For that product, the DATE variable contains dates for each day, and the QtySold variable contains the number of products sold on that day. If you want to visualize the data for weekly sales by using a heat map, you must first aggregate the data according to the year and the week of the year. In the SAS DATA step, you can assign the WEEK and YEAR_OF_WEEK variables by using the following logic:
data Snacks; set Sashelp.Snacks(where=(Product="Tortilla chips")); week = week(date, 'v'); /* is the week part of last year, next year, or this year? */ if week=1 then Year_of_week = year(Date+7); /* if Week=1, use the new year */ else if week>=52 then Year_of_week = year(Date-7); /* if Week=52 or 53, use the previous year */ else Year_of_week = year(Date); /* otherwise, use the current year */ output; label Year_of_week = "Year"; run; |
You can then use your favorite procedure to aggregate the data. You can use a heat map to visualize the quantity sold for each week.
/* accumulate QtySold for each week of each year */ proc means data=Snacks noprint; class Year_of_week Week; var QtySold; output sum= out=SnackOut(where=(_Type_=3)); /* _TYPE_=3 is the sum for each (Year, Week) combination */ run; /* use a diverging color ramp to show deviations from a midrange baseline */ %let DivRedBlueModel = (CX2166AC CX67A9CF CXD1E5F0 CXFDDBC7 CXEF8A62 CXB2182B); ods graphics / height=180px width=640px; title "Weekly Sales of Tortilla Chips"; proc sgplot data=SnackOut; heatmapparm x=Week y=Year_of_week colorresponse=QtySold / colormodel=&DivRedBlueModel; yaxis display=(nolabel) integer labelattrs=(size=6pt) reverse fitpolicy=none; xaxis labelattrs=(size=8pt) values=(1 to 53 by 4); run; |
To obtain the correct analysis and graph, we must use special logic to associate a week to a year.
Summary
The WEEK function in SAS returns a week number from a date. I recommend that you use the ISO standard, which means calling the WEEK function as week(Date,'V'). The ISO standard starts every week on Monday, and every week contains severn days. Most years have 52 weeks, but some years have "leap weeks." In most years, there is a week that contains some days in the previous year and some days in the new year. Consequently, you need to use special logic to ensure that data in a week is assigned to the correct year.
The WEEK function also supports a non-ISO algorithm, which is described in the Appendix.
Appendix: The non-ISO WEEK function
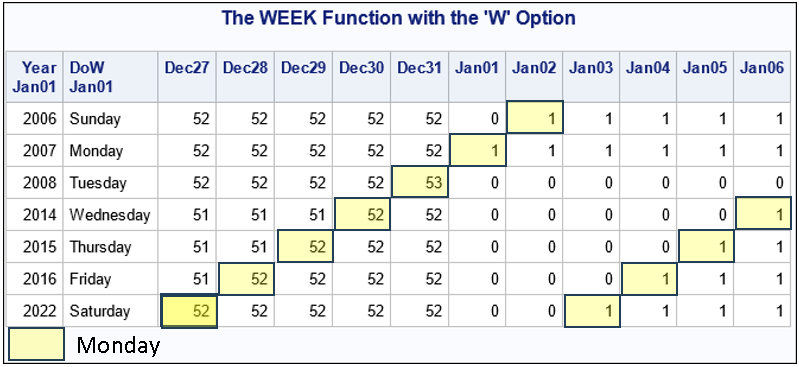
The WEEK function in SAS use the ISO standard when you use the 'V' option. The WEEK function also supports non-ISO algorithms for assigning weeks. If you do not use the 'V' option, the WEEK function will return "partial weeks." A partial week has fewer than seven days in it. The week at the end of a year will be numbered by 52 or 53. The days in the new year that are part of the previous week are given the number 0. The value Week=1 is the first FULL week of the new year.
The WEEK function supports two non-ISO options:
- The 'U' option starts each week on Sunday instead of Monday. This is the default behavior when you omit the option.
- The 'W' option starts each week Monday.
The following table shows the week numbers for some years. This table is similar to the previous table in this article, but the 'W' option results in "partial weeks." Notice the Week=0 indicates days in the new year that belong to a week that started in the previous year.

4 Comments
At the risk of a little obfuscation you could use the one-liner:
Year_of_week = year(date - min(7, 7 * floor((week - 2) / 50))) ;
to derive the year from the week number without needing the complex if statement.
Pingback: How to position tick marks for months when you graph weekly data - The DO Loop
This is nice. Always looking for sample code to produce heat maps.
I'm using SAS 9.4 for Windows (M7), and it ran fine there.
Then I tried the code in SAS Enterprise Guide for Windows (version 8.3), also on my computer, and my output was just was the outline axis text, all together on one line - no chart.
The LOG showed that the code ran, but showed no error. Do I need a more recent SAS Enterprise Guide build, perhaps?
I am not aware of any issues that would make the code not work from EG. There is nothing there that uses recent versions of SAS. I would encourage you to look for a cut-and-paste error such as a missing token (eg, a semicolon) or copying a non-ASCII character. When copying from a webpage, sometimes quotation marks and dashes get pasted as RTF characters.