In a correlation analysis, it is common to consider the correlations between all pairs of numerical variables. That is, if there are k numerical variables, most people examine the complete k x k matrix of correlations. This matrix is symmetric and has 1s on the diagonal, so more than half of the information is redundant.
Sometimes, we are not interested in all correlations, but only those between one group of variables and another group. For example, one group of variables might be related to socioeconomic status (such as income and race) and another group might be related to health outcomes (such as blood pressure, BMI, and blood glucose). This article shows two ways to compute the correlations between groups of variables in SAS.
The WITH statement in PROC CORR
In SAS, it is easy to compute the correlations between sets of variables by using the WITH statement and the VAR statement in PROC CORR. The WITH statement specifies the variables that will appear as rows of a correlation table. The VAR statement specifies the variables that will appear as columns of the same table. So, for example, the following statements compute the correlations between two groups of variables in the Sashelp.Cars data set. The WITH variables are related to the power of a vehicle's engine. The VAR variables are related to the size of the vehicle.
/* compute correlations only between different sets of variables */ options nolabel; /* <== suppress labels for all variables. See https://blogs.sas.com/content/iml/2012/08/13/suppress-variable-labels-in-sas-procedures.html */ %let RNames = Horsepower Cylinders EngineSize; /* specify variables for ROWS */ %let CNames = Weight Length; /* specify variables for COLUMNS */ proc corr data=sashelp.cars noprob nosimple NOMISS; /* NOMISS ==> listwise deletion */ with &RNames; /* rows */ var &CNames; /* columns */ run; options label; /* <== re-enable labels */ |

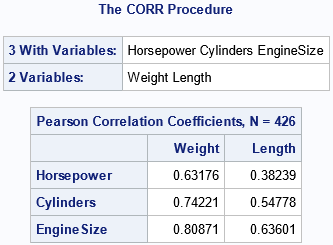
Notice that the result is a 3 x 2 table of correlations. The three variables on the WITH statement are displayed as rows; the two variables on the VAR statement are displayed as columns.
Listwise versus pairwise deletion of missing values
This call to PROC CORR uses the NOMISS option, which results in listwise deletion of missing values. That is, if any of the variables have a missing value, the observation is deleted before the analysis. Whereas the full data contains 428 observations, there are two missing values in the Cylinders variable. The header of the table shows that N=426 complete cases were used in the analysis.
By default, PROC CORR performs pairwise deletion of missing values. These means that all correlations that involve the Cylinders variable are based on 426 observations, whereas correlations that do not involve the Cylinders variable use 428 observations. If you remove the NOMISS option, not only is the output harder to read, but you are not treating the data as multivariate. This can complicate modeling and inferential statistics.
Correlations between columns of matrices in PROC IML
The CORR function in IML does not have an option to perform a correlation between two numerical matrices that have the same number of rows. However, you can horizontally concatenate the matrices, compute the correlation matrix for the full data, and then extract the relevant correlations. If the first group has nR variables and the second group has nC variables, you can put the first variables into the first nR columns of a data matrix and the second variables into the next nC columns. You can then use the CORR function in IML to compute the correlations. (The CORR function uses listwise deletion as the default method of handling missing values.) In the resulting (nR + nC) x (nR + nC) correlation matrix, the relevant correlations are in the first nR rows and the last nC columns. You can extract a submatrix by using subscripts to specify the rows and columns, as follows:
proc iml; RNames = propcase({&RNames}); CNames = propcase({&CNames}); use sashelp.cars; read all var {&RNames &CNames} into Z; close; R = corr(Z); /* compute all correlations (listwise deletion) */ /* pick out the correlations between groups */ nR = ncol(RNames); nC = ncol(CNames); RIdx = 1:nR; CIdx = (nR+1):(nR+nC); WithCorr = R[ RIdx, CIdx ]; print WithCorr[r=RNames c=CNames F=8.5]; |

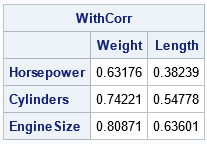
The result is the same as was displayed by using PROC CORR.
You can easily encapsulate these steps into a SAS IML function that takes two matrices and returns the correlations between columns of one and columns of the other. The Appendix defines this function.
Summary
This article shows how to use the WITH statement in PROC CORR to perform a correlation analysis on two groups of variables. The analysis uses the NOMISS option on the PROC CORR statement to perform listwise deletion of missing values. Although PROC IML does not natively support correlation between two data matrices, you can easily write a function that performs the analysis. See the Appendix for the function definition.
An earlier article uses pairwise deletion to compute the correlations between variables. Except for how missing values are handled, the two articles are similar.
Appendix: A SAS IML function for correlation between columns of two matrices
/* Define a function that returns the correlation between columns of X and columns of Y. Missing values are handled by using listwise deletion. */ proc iml; RNames = {'Horsepower' 'Cylinders' 'EngineSize'}; CNames = {'Weight' 'Length'}; /* read variables into columns of two matrices, X and Y */ use sashelp.cars; read all var RNames into X; read all var CNames into Y; close; /* compute correlation between columns of X and columns of Y */ start CorrWith(X, Y); R = corr(X || Y); /* compute all correlations (listwise deletion) */ /* pick out the correlations between groups */ nR = ncol(X); nC = ncol(Y); RIdx = 1:nR; CIdx = (nR+1):(nR+nC); WithCorr = R[ RIdx, CIdx ]; return WithCorr; finish; WithCorr = CorrWith(X, Y); print WithCorr[r=RNames c=CNames F=8.5]; |

