The first time I saw a formula for the pooled variance, I was quite confused. It looked like Frankenstein's monster, assembled from bits and pieces of other quantities and brought to life by a madman. However, the pooled variance does not have to be a confusing monstrosity. The verb "to pool" means to combine resources from several sources, as in, "if the siblings pool their money, they can buy a nice gift for their mother." Thus a "pooled variance" combines information from several subgroups of the data in order to obtain a better estimate. This article shows how to understand the pooled variance, which is an average of the sample variances for subgroups of the data.
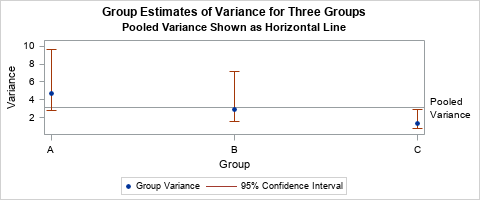
The following graph visualizes the pooled variance and the variances within groups. In the graph, there are three groups. The sample variance within each group is plotted as a blue marker. The pooled variance is indicated by a horizontal line. The pooled variance appears to be an average of the three sample variances. The exact formulas and the data for this graph are explained in subsequent sections.
The pooled variance is an average of group variances
Most students first encounter the pooled variance in a statistics course when learning about two-sample t tests. In a two-sample t test, you have data in two groups and you want to test whether the means of the two groups are different. In order to run a two-sample t test, you need to decide whether you think the variances of the two groups are equal. If you think the group variances are equal, you compute the pooled variance, which estimates the common variance. You use the pooled variance estimate to compute the t statistic.
The pooled variance combines (or "pools") the variance estimates within the individual groups. The pooled variance is a better estimate of the (unknown) common group variance than either of the individual group variances. If each group has the same number of observations, then the pooled variance is a simple average. If the group sizes are different, then the pooled variance is a weighted average, where larger groups receive more weight than smaller groups.
For the two-sample case, let \(s_1^2\) and \(s_2^2\) be the sample variances within the groups A and B, respectively.
Let \(n_1\) and \(n_2\), respectively, be the number of observations in the groups.
If you assume that the data in each group have the same variance, how can you estimate that common variance?
One way is to "pool" the variances of each group and compute a weighted average of the variances. For two groups, the pooled variance is
\(s_p^2 = \frac{(n_1-1)s_1^2 + (n_2-1)s_2^2}{n_1 + n_2- 2}\)
The numerator is the weighted sum of the group variances.
Dividing by the sum of the weights means that the pooled variance is the weighted average of the two quantities.
Notice that if \(n_1 = n_2\), then the formula simplifies. When the group sizes are equal, the pooled variance reduces to \(s_p^2 = (s_1^2 + s_2^2)/2\), which is the average of the two variances.
The idea behind the pooled variance generalizes to multiple groups.
Suppose you collect data for \(k\) groups and \(s_i^2\) is the sample variance within the \(i\)th group, which has \(n_i\) observations. If you believe that the groups have a common variance, how might you estimate it? One way is to compute the pooled variance as a weighted average of the group variances:
\(s_p^2 = \Sigma_{i=1}^k (n_i-1)s_i^2 / \Sigma_{i=1}^k (n_i - 1)\)
Again, if all groups have the same number of observations, then the formula simplifies to
\(\Sigma_{i=1}^k s_i^2 / k\), which is the average of the \(k\) variances.
Visualize the pooled variance
Formulas are necessary for computation, but I like to think in pictures. You can draw a graph that shows how the pooled variance relates to the variances of the groups.
Let's use an example that has three groups: A, B, and C. The following data (adapted from an example in the SAS documentation) are the ozone measurements (Y, in parts per billion) at three different collection sites (A, B, and C):
Site n Ozone (ppb) ==== === ============================================= A 22 4 6 3 4 7 8 2 3 4 1 3 8 9 5 6 4 6 3 4 7 3 7 B 15 5 3 6 2 1 2 4 3 2 4 6 4 6 3 6 C 18 8 9 7 8 6 7 6 7 9 8 9 8 7 8 5 8 9 7 |
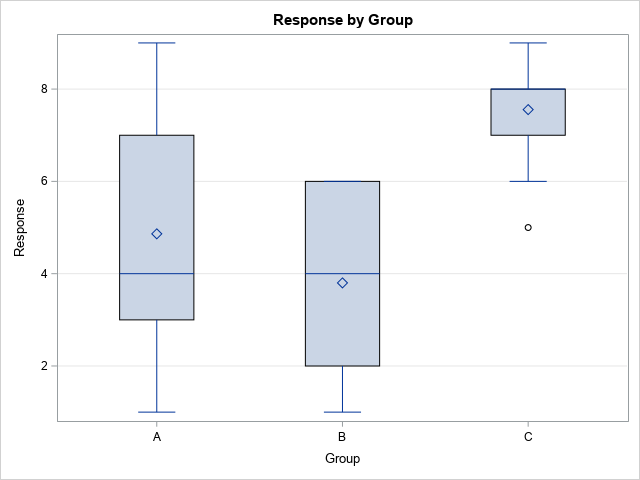
The following graph shows a box plot of the ozone levels at each site. The height of each box gives a rough estimate of the variance in each group. The mean and variance for sites A and B appear to be similar to each other. However, the mean at site C appears to be larger and the variance seems smaller, compared to the other sites.
You can use your favorite statistical software to estimate the variance of the data for each site. The following table is produced in SAS by using the UNIVARIATE procedure and the CIBASIC option:
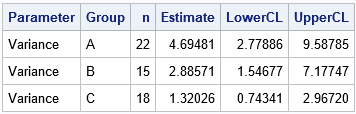
The table shows an estimate for the variance of the data within each group. Although the smallest sample variance (Group C: 1.32) seems much smaller than the largest sample variance (Group A: 4.69), notice that the 95% confidence intervals overlap. A parameter value such as 2.8 or 2.9 would simultaneously be in all three confidence intervals.
If we assume that the variance of the groups are equal, the pooled variance formula provides a way to estimate the common variance. Applying the formula, the estimate for the pooled variance for these data is
\(s_p^2 = (21*4.69 + 14*2.89 + 17*1.32) / (21+14+17) = 3.10\)
The graph at the top of this article visualizes the information in the table and uses a reference line to indicate the pooled variance. The blue markers indicate the sample variances of each group. The confidence intervals for the population variances are shown by the vertical lines. The pooled variance is indicated by the horizontal reference line. It is the weighted average of the sample variances. If you think that all groups have the same variance, the pooled variance estimates that common variance.
Summary
In two-sample t tests and ANOVA tests, you often assume that the variance is constant across different groups in the data. The pooled variance is an estimate of the common variance. It is a weighted average of the sample variances for each group, where the larger groups are weighted more heavily than smaller groups.
You can download a SAS program that computes the pooled variance and creates the graphs in this article. Although the pooled variance provides an estimate for a common variance among groups, it is not always clear when the assumption of a common variance is valid. The visualization in this article can help, or you can perform a formal "homogeneity of variance" test as part of an ANOVA analysis.

4 Comments
Pingback: Top posts from The DO Loop in 2020 - The DO Loop
Hi, I am a graduate student in South Korea. Thank you for posting such a nice lecture. It was very helpful.
I have a question, though. When you get the pooled variance with three samples for example, you calculated the pooled variance like,
Spool^2 = ((n1-1)*s1^2 + (n2-1) *s2^2 + (n3-1)*s3^2 )/df (where df= n1+n2+n3-3). This.
But when you get the Standard Error to get t-value using the pooled variance, how would you do it? my friend told me to do like SE= ((Spool^2) /(n1-1) + (Spool^2)/(n2-1))^(1/2) this. But I do not understand why you do not consider all three samples. I mean, it seems like my friend only took into account 2 samples according to the above equation.
I don't know if my question is understandable. I will looking forward to your reply. Thank you.
I understand your question. I suggest you discuss it with your advisor.
Pingback: Cohen's D statistic in SAS - The DO Loop