Search Results: proc loess (42)

Analytics | Data Visualization
Rick Wicklin 4
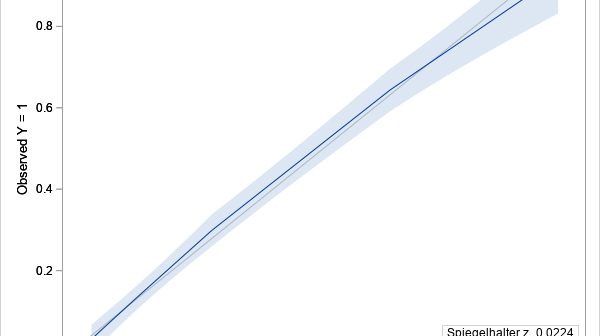
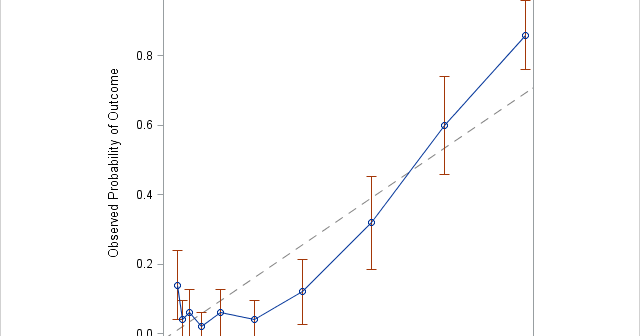
Decile plots in SAS

I previously showed how to create a decile calibration plot for a logistic regression model in SAS. A decile calibration plot (or "decile plot," for short) is used in some fields to visualize agreement between the data and a regression model. It can be used to diagnose an incorrectly specified

Data Visualization | Learn SAS
Rick Wicklin 7
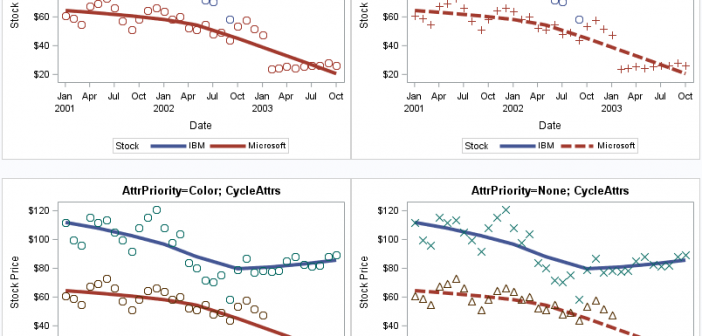
Attrs, attrs, everywhere: The interaction between ATTRPRIORITY, CYCLEATTRS, and STYLEATTRS in ODS graphics

If you use PROC SGPLOT to create ODS graphics, "ATTRS" are everywhere. ATTRS is an abbreviation of "attributes." Most options that change the attributes of a graphical element end with the ATTRS suffix. For example, the MARKERATTRS option modifies attributes of markers, the LINEATTRS option modifies attributes of lines, and