When someone refers to the correlation between two variables, they are probably referring to the Pearson correlation, which is the standard statistic that is taught in elementary statistics courses. Elementary courses do not usually mention that there are other measures of correlation.
Why would anyone want a different estimate of correlation? Well, the Pearson correlation, which is also known as the product-moment correlation, uses empirical moments of the data (means and standard deviations) to estimate the linear association between two variables. However, means and standard deviations can be unduly influenced by outliers in the data, so the Pearson correlation is not a robust statistic.
A simple robust alternative to the Pearson correlation is called the Spearman rank correlation, which is defined as the Pearson correlation of the ranks of each variable. (If a variable contains tied values, replace those values by their average rank.) The Spearman rank correlation is simple to compute and conceptually easy to understand. Some advantages of the rank correlation are
- The rank correlation is always in the interval [-1, 1]. For "tame" data, the Spearman and Pearson correlations are close to each other. In fact, if X and Y are bivariate normal random variables with Pearson correlation ρ, then the Spearman correlation is 6/π arcsin(ρ/2), which is very close to the identity function on [-1, 1].
- The rank correlation is robust to outliers. For example, the data set X={1, 2, 2, 5} has the same ranks as the set Y={1, 2, 2, 500}. Therefore for any third variable Z, the rank correlation between X and Z is the same as the rank correlation between Y and Z.
- The rank correlation is invariant under any monotonic increasing transformation of the data, such as LOG, EXP, and SQRT. In the previous example, the rank correlation between Z and X is the same as the rank correlation between Z and the log-transform of X, which is {log(1), log(2), log(2), log(5)}. This is in contrast to the Pearson correlation, which is only invariant under affine transformations with positive scaling factors (X → a*X + b, where a > 0).
- The rank correlation can be used for any ordinal variable. For example, if the variable X has the ordinal values {"Very Unsatisfied", "Unsatisfied", "Satisfied", "Very Satisfied"}, and the variable Y has the ordinal values {"Low", "Medium", "High"}, then you can compute a rank correlation between X and Y.
Compute rank correlation in SAS
PROC CORR in SAS supports several measures of correlation, including the Pearson and Spearman correlations. For data without outliers, the two measures are often similar. For example, the following call to PROC CORR computes the Spearman rank correlation between three variables in the Sashelp.Class data set:
/* Compute PEARSON and SPEARMAN rank correlation by using PROC CORR in SAS */ proc corr data=sashelp.class noprob nosimple PEARSON SPEARMAN; var height weight age; run; |
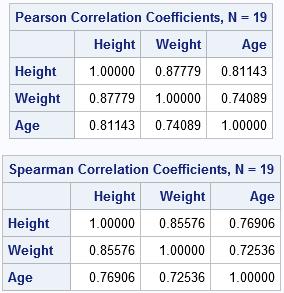
According to both statistics, these variables are very positively correlated, with correlations in the range [0.7, 0.88]. Notice that the rank correlations (the lower table) are similar to the Pearson correlations for these data. However, if the data contain outliers, the rank correlation estimate is less influenced by the magnitude of the outliers.
Compute rank correlation manually
As mentioned earlier, the Spearman rank correlation is conceptually easy to understand. It consists of two steps: compute the ranks of each variable and compute the Pearson correlation between the ranks. It is instructive to reproduce each step in the Spearman computation. You can use PROC RANK in SAS to compute the ranks of the variables, then use PROC CORR with the PEARSON option to compute the Pearson correlation of the ranks. If the data do not contain any missing values, then the following statements implement to two steps that compute the Spearman rank correlation:
/* Compute the Spearman rank correlation "manually" by explicitly computing ranks */ /* First compute ranks; use average rank for ties */ proc rank data=sashelp.class out=classRank ties=mean; var height weight age; ranks RankHeight RankWeight RankAge; run; /* Then compute Pearson correlation on the ranks */ proc corr data=classRank noprob nosimple PEARSON; var RankHeight RankWeight RankAge; run; |
The resulting table of correlations is the same as in the previous section and is not shown. Although PROC CORR can compute the rank correlation directly, it is comforting that these two steps produce the same answer. Furthermore, this two-step method can be useful if you decide to implement a rank-based statistic that is not produced by any SAS procedure. This two-step method is also the way to compute the Spearman correlation of character ordinal variables because PROC CORR does not analyze character variables. However, PROC RANK supports both character and numeric variables.
If you have missing values in your data, then make sure you delete the observations that contain missing values before you call PROC RANK. Equivalently, you can use a WHERE statement to omit the missing values. For example, you could insert the following statement into the PROC RANK statements:
where height^=. & weight^=. & age^=.;
Compute rank correlation in SAS/IML software
In the SAS/IML language, the CORR function computes the Spearman rank correlation directly, as follows. The results are the same as the results from PROC CORR, and are not shown.
proc iml; use sashelp.class; read all var {height weight age} into X; close; RankCorr = corr(X, "Spearman"); /* compute rank correlation */ |
If you ever need to compute a rank-based statistic manually, you can also use the RANKTIE function to compute the ranks of the elements in a numerical vector, such as
ranktie(X[ ,1], "Mean");
Summary
The Spearman rank correlation is a robust measure of the linear association between variables. It is related to the classical Pearson correlation because it is defined as the Pearson correlation between the ranks of the individual variables. It has some very nice properties, including being robust to outliers and being invariant under monotonic increasing transformations of the data. For other measures of correlation that are supported in SAS, see the PROC CORR documentation.

7 Comments
Good afternoon,
I appreciate your continued support.
My question is when i compute as rank correlation, the default is a significance test of dfference from zero. what sytax should i use to determine if it is different from 1 (unity). This is my main interest
A 95% CI will never include rho=1, so the hypothesis H0: rho=1 will always be rejected (unless the data themselves have perfect correlation). In fact, the RHO0= option in the syntax must be strictly less than 1. I think the way to proceed is to use a one-sided test such as H0: rho > 0.99. The syntax for that is
The documentation for the Fisher transformation provide information about the FISHER option.
Pingback: Compute bivariate ranks - The DO Loop
Pingback: Compute the Hoeffding D statistic in SAS - The DO Loop
Pingback: Rank-based scores and tied values - The DO Loop
Pingback: Simulate correlated variables by using the Iman-Conover transformation - The DO Loop
Pingback: Weak or strong? How to interpret a Spearman or Kendall correlation - The DO Loop