Uncategorized

Advanced Analytics
Rick Wicklin 3
How to create a grid of values?

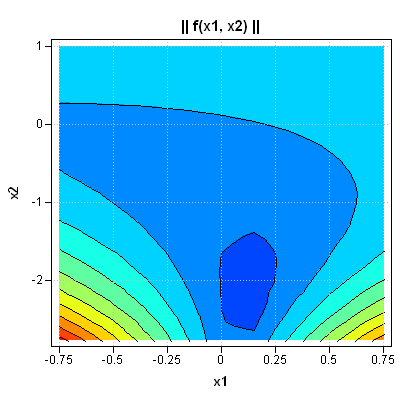
In a previous post, I described ways to create SAS/IML vectors that contain uniformly spaced values. The methods did not involve writing any loops. This post describes how to perform a similar operation: creating evenly spaced values on a two-dimensional grid. The DATA step solution is simple, but an efficient

Advanced Analytics
Rick Wicklin 3
When sharks attack!

The Junk Chart blog discusses problems with a chart which (poorly) presents statistics on the prevalence of shark attacks by different species. Here is the same data presented by overlaying two bar charts by using the SGPLOT procedure. I think this approach works well because the number of deaths is

1 143 144 145 146 147 151