Good old Scotch drink!
Inspire me, until I lisp and wink,
To sing your name!
-- Robert Burns (1785)
Scotch whisky (spelled without an 'e') is a popular drink that makes up a multi-billion dollar industry. Scotch whisky accounts for almost 75% of Scotland's food and drink exports! Poets have lauded it. (See Appendix 2.) On television and in movies, amber-brown whiskies are consumed by upper-class characters who have (or crave) power, prestige, and wealth. But for those of us who are not so wealthy, it is scary to spend $50 or more on a bottle of whisky that we might not enjoy.
Fortunately, statistics can help us to identify whiskies that we might like or dislike based on others that we have tasted. Suppose a friend offers a "wee dram" of whisky from his private stash. Maybe we like it, maybe we don't. If we like it, we might want to find other brands that taste similar. If we hate it, we'd like to identify other brands that we should avoid.
There are several statistical methods that can identify whiskies that have a similar set of flavor characteristics, including classical techniques such as cluster analysis and factor analysis. In this article, I will use classical principal component analysis (PCA) to analyze the flavor profiles of 86 Scotch whiskies. I will show which flavor characteristics are important for differentiating whiskies. The PCA will serve as a basis for a future article, which uses a non-negative matrix factorization to analyze the same data.
The data and analyses are motivated by an article by Young, Fogel, and Hawkins (2006, "Clustering scotch whiskies using non-negative matrix factorization", SPES Newsletter). The data are from the book Whisky Classified, Choosing Single Malts by Flavor by David Wishart (2002, revised 2018), who classified Scotch whisky according to 12 favors: Tobacco, Medicinal, Smoky, Body, Spicy, Winey, Nutty, Honey, Malty, Fruity, Sweetness, and Floral.
Full disclosure: I'm a statistician, not a Scotch connoisseur! My experience tasting whisky is very limited. I have only tasted two Scotch whiskies in my life: I liked Glenfiddich, but I did not like Laphroaig.
The Scotch whisky data
Appendix 1 defines the data used by Young, Fogel, and Hawkins (2006). There are 86 brands of whisky (the rows) and 12 flavors (the columns) plus some ID variables. The following table shows the flavor profiles for a subset of 20 whiskies:
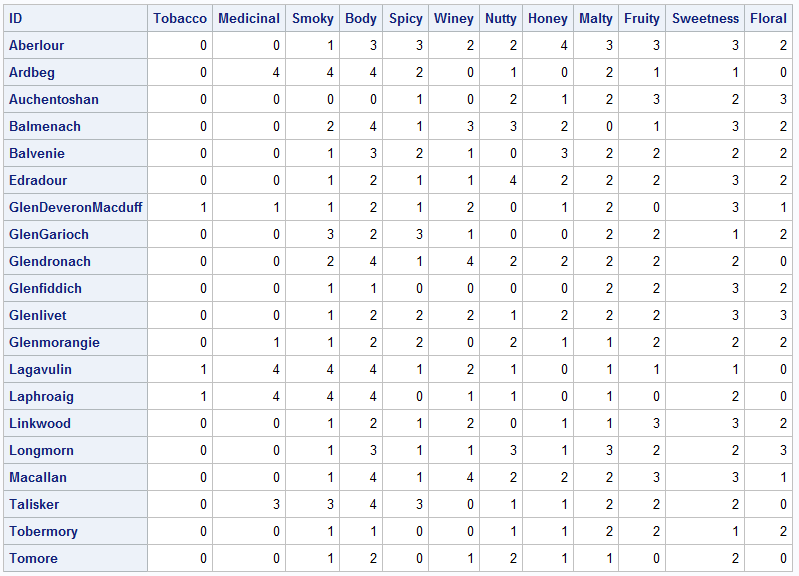
Each whisky is assigned values 0-4 for each flavor, which indicates the absence of a flavor (0) or an intense expression of that flavor (4). Let's look at the flavor profiles for the two whiskies that I have tasted:
- Glenfiddich is light-bodied and a little smoky. Its predominant characteristic is sweetness, and it has secondary characteristics of malty, fruity, and floral.
- Laphroaig is full-bodied and very smoky and medicinal. It has a little sweetness with hints of tobacco, winey, nutty, and malty.
Principal components: Extracting flavor profiles
Flavors are imparted during various steps in the distillation process such as malting, fermentation, and maturing the whisky in oak casks. They are interconnected and cannot be independently controlled by the blender. Scotch whisky can only contain water, grain, and yeast, so the Master Blender cannot add nuts or honey or fruit to affect the taste of the finished product.
Because the flavors are correlated, a principal component analysis (PCA) is a classical way to identify combinations of flavors that most explain the variance in the 12-dimensional flavor space. A common use of PCA is to reduce the dimensionality of the problem from 12 flavor characteristics to a smaller number of "principal components," which are linear combinations of the flavors. Following Young, Fogel, and Hawkins (2006), I choose four PCs, which explain almost 70% of the variability in the data. In SAS, you can use the following call to PROC PRINCOMP to perform a PCA and to generate many tables and graphs that explain the analysis. Because the flavors are measured on the same scale, you can specify the COV option to use the covariance matrix for the analysis:
/* PCA from PROC PRINCOMP */ %let varNames = Tobacco Medicinal Smoky Body Spicy Winey Nutty Honey Malty Fruity Sweetness Floral; proc princomp data=Whisky N=4 cov plots=all out=PC_COV_Scores; /* 'scores' = projections onto first PCs */ var &VarNames; ID ID; ods select Eigenvectors ScoreMatrixPlot '2 by 1' '4 by 3'; ods output Eigenvectors = PCs; run; |
The procedure outputs many tables and graphs, which are explained in the next sections.
Interpreting the principal components
The most important output from a PCA is the set of eigenvectors, which are used as the basis vectors. The following table shows four eigenvectors, which are called the first four principal components (PCs).
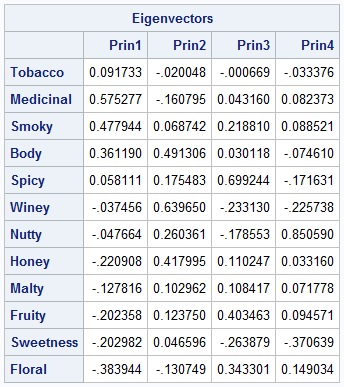
- The first column shows how the first (and most important) PC relates to the original variables. The first PC represents high values of Smoky, Medicinal, and Tobacco flavors and low values of Honey, Fruity, Sweetness, and Floral. Thus, the first PC dimension contrasts harsh "masculine" flavors from sweeter "feminine" flavors.
- The second column represents whiskies that have many taste characteristics. The second PC is associated with full-bodied, Winey, and Honey flavors. Because most of the values in the column are positive, this component also represents a general blend of flavors.
- The third column represents whiskies that are Spicy. It also contrasts whiskies that are high in Fruity and Floral flavors from those that are high in Sweetness and Winey.
- The fourth column represents whiskies that are Nutty. It contrasts them with Winey and Sweetness flavors.
A PCA is a "contrast-revealing" algorithm. In a PCA analysis, the eigenvectors are orthogonal to each other. This forces the principal components to contain both positive and negative weights. This allows PCA to create contrasts between flavors, but it is unintuitive to think about a whisky having a 'negative' amount of a flavor! In a subsequent article, I'll show how the nonnegative matrix factorization (NMF) drops the orthogonality constraint so that it can build flavor profiles additively.
Visualizing the principal components: Component pattern plots
These PCs are easier to visualize if we view the "component pattern" plots, which I have described in a previous article. They show the correlations between the principal components and the original variables. The following graph shows the correlations between the original variables and the first two PCs.
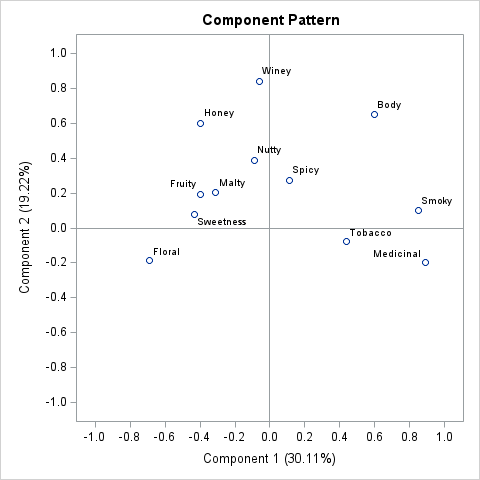
Notice that the horizontal axis separates the "masculine" flavors from the sweet and fruity and floral flavors. Similarly, the vertical axis is positively correlated with most of the flavors, but is highly correlated with Winey, Body, and Honey.
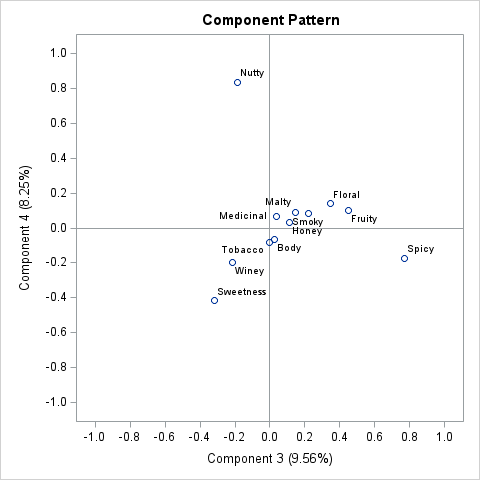
You can show a similar plot for the third and fourth PCs:
Interpreting the PC scores: Identifying similar and dissimilar whiskies
Because the PCs differentiate between various flavors, it is useful to project the original observations onto the basis of the PCs. This is called "scoring," and the resulting scatter plot are called score plots. It is useful to identify the points by the name of the distillery. However, since distillery names can be quite long (eg, "GlenDeveronMacduff"), I have used distillery names for 20 selected whiskies and have used row numbers to identify the remaining whiskies. The score plot for first two PCs is shown below:
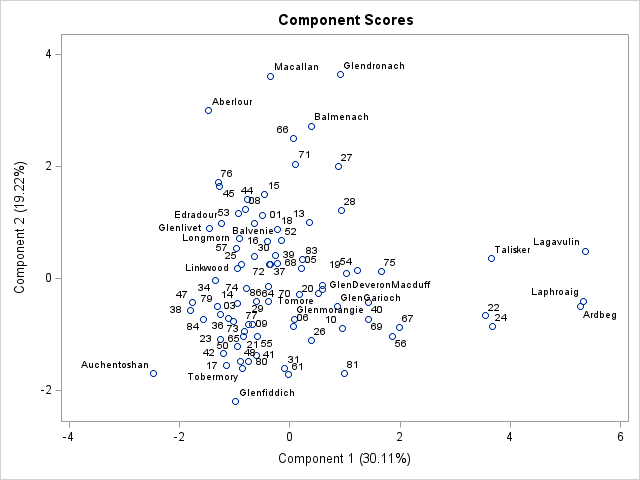
In these plots, the origin (0,0) represents a hypothetical whisky that has the "average" flavor profile. Whiskies in the upper-right quadrant have greater-than-average flavors in both components, whereas whiskies in the lower-left quadrant have less-than-average flavor in both components.
This is the most important plot for a beginner to study. Why? Because the whiskies to the right are "strong" on the first PC, meaning that they are full-bodied with strong accents of Smoky, Medicinal, and Tobacco flavors, and low values of Honey, Fruity, Sweetness, and Floral. The Laphroaig whisky, which I have tasted and did not like, is far to right. Thus, I know to steer clear of similar whiskies such as Ardberg and Lagavulin.
In a similar way, the whiskies at the top of the plot (Macallan and Glendronach) represent whiskies that are full-bodied with predominately Winey and Honey flavors. Notice that Macallan and Glendronach have approximately 0 score on the horizontal axis, which means that they are not strong associated with the flavors represented by the first PC. The Glenfiddich whisky, which I like, is at the bottom of this graph. That means it is light-bodied and does not have Winey and Honey flavors. It is left-of-center on the horizontal scale, so it does not have the strong "masculine" flavors that I dislike about Laphroaig.
The score plot onto the third and fourth PCs provide additional information, primarily about the Spicy and Nutty flavors.
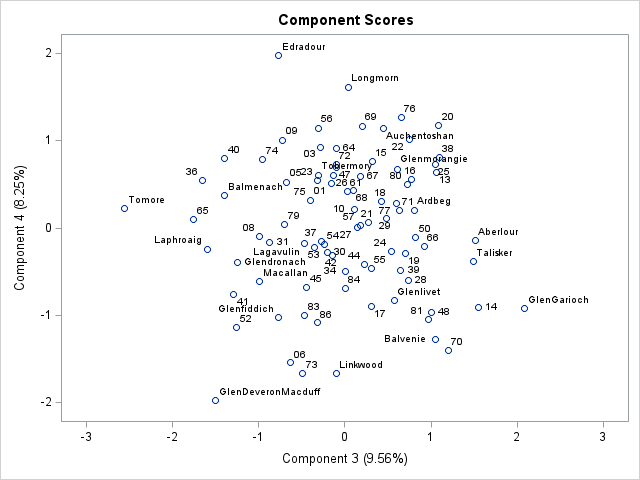
Whiskies on the right side of this plot include GlenGarioch and Talisker, which are spicy. To the left are Tomore and Laphroaig, which have no Spicy flavor. High on the vertical axis are Edradour and Longmorn, which are nutty. At the bottom of the plot are Linkwood and GlenDeveronMacduff, which have no Nutty flavor.
For the whiskies I have tasted, Laphroaig is to the left and in the middle, indicating that it has no Spicy flavor and a moderate amount of Nutty flavor. Glenfiddich is in the lower-left quadrant, so it has negligible Spicy and Nutty flavors.
Summary
The purpose of this article is to introduce the Scotch whisky data set, which classifies the flavors in 86 Scotch whiskies according to 12 flavor characteristics. These data were analyzed by Young, Fogel, and Hawkins (2006), who used nonnegative matrix factorization (NMF). I intend to describe that analysis in a subsequent article. However, the strengths of the NMF are best appreciated when compared with a conventional principal component analysis (PCA), which is a classical way to identify combinations of variables that explain the variance in the 12-dimensional flavor space. This article shows how a PCA can help someone who is ignorant about single-malt whiskies to understand which distilleries have similar flavor profiles.
Appendix 1: Scotch whisky data
Define a SAS data set that contains the original data from Wishart (2004) that was analyzed by Young, Fogel, and Hawkins (2006). Then add a new variable, SELECTED, for 20 whiskies that are either popular brands (eg, Glenlivet, Glenfiddich, Macallan,...) or have extreme scores in a PCA of the data.
/* Perform a principal component analysis (PCA) of the Scotch Whisky data set in Young, Fogel, and Hawkins (SPES, 2006), who analyzed the data by using a nonnegative matrix factorization (NMF). The article is available at https://www.niss.org/sites/default/files/ScotchWhisky.pdf I downloaded the data from https://www.niss.org/sites/default/files/ScotchWhisky01.txt and corrected a few typos: - ID=12: Replaced 'Belvenie' with 'Balvenie' - ID=56: Replaced 'Laphroig' with 'Laphroaig' */ data Whisky_Orig; infile datalines dsd dlm=','; length Distillery $20; input RowID Distillery Body Sweetness Smoky Medicinal Tobacco Honey Spicy Winey Nutty Malty Fruity Floral; datalines; 01,Aberfeldy,2,2,2,0,0,2,1,2,2,2,2,2 02,Aberlour,3,3,1,0,0,4,3,2,2,3,3,2 03,AnCnoc,1,3,2,0,0,2,0,0,2,2,3,2 04,Ardbeg,4,1,4,4,0,0,2,0,1,2,1,0 05,Ardmore,2,2,2,0,0,1,1,1,2,3,1,1 06,ArranIsleOf,2,3,1,1,0,1,1,1,0,1,1,2 07,Auchentoshan,0,2,0,0,0,1,1,0,2,2,3,3 08,Auchroisk,2,3,1,0,0,2,1,2,2,2,2,1 09,Aultmore,2,2,1,0,0,1,0,0,2,2,2,2 10,Balblair,2,3,2,1,0,0,2,0,2,1,2,1 11,Balmenach,4,3,2,0,0,2,1,3,3,0,1,2 12,Balvenie,3,2,1,0,0,3,2,1,0,2,2,2 13,BenNevis,4,2,2,0,0,2,2,0,2,2,2,2 14,Benriach,2,2,1,0,0,2,2,0,0,2,3,2 15,Benrinnes,3,2,2,0,0,3,1,1,2,3,2,2 16,Benromach,2,2,2,0,0,2,2,1,2,2,2,2 17,Bladnoch,1,2,1,0,0,0,1,1,0,2,2,3 18,BlairAthol,2,2,2,0,0,1,2,2,2,2,2,2 19,Bowmore,2,2,3,1,0,2,2,1,1,1,1,2 20,Bruichladdich,1,1,2,2,0,2,2,1,2,2,2,2 21,Bunnahabhain,1,2,1,1,0,1,1,1,1,2,2,3 22,Caol Ila,3,1,4,2,1,0,2,0,2,1,1,1 23,Cardhu,1,3,1,0,0,1,1,0,2,2,2,2 24,Clynelish,3,2,3,3,1,0,2,0,1,1,2,0 25,Craigallechie,2,2,2,0,1,2,2,1,2,2,1,4 26,Craigganmore,2,3,2,1,0,0,1,0,2,2,2,2 27,Dailuaine,4,2,2,0,0,1,2,2,2,2,2,1 28,Dalmore,3,2,2,1,0,1,2,2,1,2,3,1 29,Dalwhinnie,2,2,2,0,0,2,1,0,1,2,2,2 30,Deanston,2,2,1,0,0,2,1,1,1,3,2,1 31,Dufftown,2,3,1,1,0,0,0,0,1,2,2,2 32,Edradour,2,3,1,0,0,2,1,1,4,2,2,2 33,GlenDeveronMacduff,2,3,1,1,1,1,1,2,0,2,0,1 34,GlenElgin,2,3,1,0,0,2,1,1,1,1,2,3 35,GlenGarioch,2,1,3,0,0,0,3,1,0,2,2,2 36,GlenGrant,1,2,0,0,0,1,0,1,2,1,2,1 37,GlenKeith,2,3,1,0,0,1,2,1,2,1,2,1 38,GlenMoray,1,2,1,0,0,1,2,1,2,2,2,4 39,GlenOrd,3,2,1,0,0,1,2,1,1,2,2,2 40,GlenScotia,2,2,2,2,0,1,0,1,2,2,1,1 41,GlenSpey,1,3,1,0,0,0,1,1,1,2,0,2 42,Glenallachie,1,3,1,0,0,1,1,0,1,2,2,2 43,Glendronach,4,2,2,0,0,2,1,4,2,2,2,0 44,Glendullan,3,2,1,0,0,2,1,2,1,2,3,2 45,Glenfarclas,2,4,1,0,0,1,2,3,2,3,2,2 46,Glenfiddich,1,3,1,0,0,0,0,0,0,2,2,2 47,Glengoyne,1,2,0,0,0,1,1,1,2,2,3,2 48,Glenkinchie,1,2,1,0,0,1,2,0,0,2,2,2 49,Glenlivet,2,3,1,0,0,2,2,2,1,2,2,3 50,Glenlossie,1,2,1,0,0,1,2,0,1,2,2,2 51,Glenmorangie,2,2,1,1,0,1,2,0,2,1,2,2 52,Glenrothes,2,3,1,0,0,1,1,2,1,2,2,0 53,Glenturret,2,3,1,0,0,2,2,2,2,2,1,2 54,Highland Park,2,2,3,1,0,2,1,1,1,2,1,1 55,Inchgower,1,3,1,1,0,2,2,0,1,2,1,2 56,Isle of Jura,2,1,2,2,0,1,1,0,2,1,1,1 57,Knochando,2,3,1,0,0,2,2,1,2,1,2,2 58,Lagavulin,4,1,4,4,1,0,1,2,1,1,1,0 59,Laphroaig,4,2,4,4,1,0,0,1,1,1,0,0 60,Linkwood,2,3,1,0,0,1,1,2,0,1,3,2 61,Loch Lomond,1,1,1,1,0,1,1,0,1,2,1,2 62,Longmorn,3,2,1,0,0,1,1,1,3,3,2,3 63,Macallan,4,3,1,0,0,2,1,4,2,2,3,1 64,Mannochmore,2,1,1,0,0,1,1,1,2,1,2,2 65,Miltonduff,2,4,1,0,0,1,0,0,2,1,1,2 66,Mortlach,3,2,2,0,0,2,3,3,2,1,2,2 67,Oban,2,2,2,2,0,0,2,0,2,2,2,0 68,OldFettercairn,1,2,2,0,1,2,2,1,2,3,1,1 69,OldPulteney,2,1,2,2,1,0,1,1,2,2,2,2 70,RoyalBrackla,2,3,2,1,1,1,2,1,0,2,3,2 71,RoyalLochnagar,3,2,2,0,0,2,2,2,2,2,3,1 72,Scapa,2,2,1,1,0,2,1,1,2,2,2,2 73,Speyburn,2,4,1,0,0,2,1,0,0,2,1,2 74,Speyside,2,2,1,0,0,1,0,1,2,2,2,2 75,Springbank,2,2,2,2,0,2,2,1,2,1,0,1 76,Strathisla,2,2,1,0,0,2,2,2,3,3,3,2 77,Strathmill,2,3,1,0,0,0,2,0,2,1,3,2 78,Talisker,4,2,3,3,0,1,3,0,1,2,2,0 79,Tamdhu,1,2,1,0,0,2,0,1,1,2,2,2 80,Tamnavulin,1,3,2,0,0,0,2,0,2,1,2,3 81,Teaninich,2,2,2,1,0,0,2,0,0,0,2,2 82,Tobermory,1,1,1,0,0,1,0,0,1,2,2,2 83,Tomatin,2,3,2,0,0,2,2,1,1,2,0,1 84,Tomintoul,0,3,1,0,0,2,2,1,1,2,1,2 85,Tomore,2,2,1,0,0,1,0,1,2,1,0,0 86,Tullibardine,2,3,0,0,1,0,2,1,1,2,2,1 ; /* For later analysis, identify some of the most popular single-malt Scotch whiskies (eg, Glenlivet, Glenfiddich, Macallan,...) and some that have extreme scores in a PCA of the data. */ data Whisky / view=Whisky; length ID $20; set Whisky_Orig; selected = 0; BestSeller = 0; if Distillery in ( 'Glenlivet' 'Glenfiddich' 'Macallan' 'Glenmorangie' 'Balvenie' 'Laphroaig' 'Aberlour' 'Lagavulin' 'Ardbeg' 'Talisker' ) then BestSeller=1; /* also select a few whiskies that have extreme values in a PC */ if BestSeller | RowID in (07 11 32 33 35 43 60 62 82 85) then selected = 1; if selected then ID = Distillery; else ID = put(RowID, Z2.); run; %let varNames = Tobacco Medicinal Smoky Body Spicy Winey Nutty Honey Malty Fruity Sweetness Floral; proc print data=Whisky; where selected; ID ID; var &VarNames; run; |
Appendix 2: Robert Burns' "Scotch Drink" poem
Robert Burns was one of Scotland's most famous poets. One of his poems, "Scotch Drink" (1785), is an ode to whisky. It contains more than 20 verses, but here is one amusing verse:
O thou, my muse! guid auld Scotch drink!
Whether thro' wimplin worms thou jink,
Or, richly brown, ream owre the brink,
In glorious faem,
Inspire me, till I lisp an' wink,
To sing thy name!
If the 18th century spelling is confusing, here is a modern translation that uses conventional spelling. The phrase "wimplin worms thou jink" refers to the distilling process, which uses winding coils of tubing. "To jink" means to change direction.
O you, my muse! Good old Scotch drink!
Whether through winding worms you jink,
Or, richly brown, foam over the brink,
In glorious foam,
Inspire me, until I lisp and wink,
To sing your name!
