My article about Fisher's transformation of the Pearson correlation contained a simulation. The simulation uses the RANDNORMAL function in SAS/IML software to simulate multivariate normal data. If you are a SAS programmer who does not have access to SAS/IML software, you can use the SIMNORMAL procedure in SAS/STAT software to simulate data from a multivariate normal distribution.
The 'TYPE' of a SAS data set
Most SAS procedures read and analyze raw data. However, some SAS procedures read and write special data sets that represent a statistical summary of data. PROC SIMNORMAL can read a TYPE=CORR or TYPE=COV data set. Usually, these special data sets are created as an output data set from another procedure. For example, the following SAS statements compute the correlation between four variables from a sample of 50 Iris versicolor flowers:
proc corr data=sashelp.iris(where=(Species="Versicolor")) /* input raw data */ nomiss noprint outp=OutCorr; /* output statistics */ var PetalLength PetalWidth SepalLength SepalWidth; run; proc print data=OutCorr; run; |
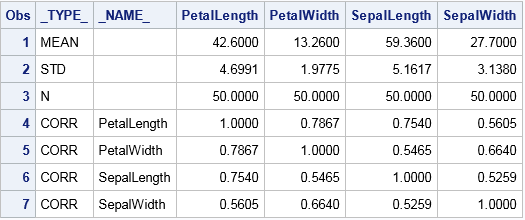
The output data set contains summary statistics including the mean, standard deviations, and correlation matrix for the four variables in the analysis. PROC PRINT does not display the 'TYPE' attribute of this data set, but if you run PROC CONTENTS you will see a field labeled "Data Set Type," which has the value "CORR".
You can also create a TYPE=CORR or TYPE=COV data set by using the DATA step as shown in the documentation for PROC SIMNORMAL.
Use PROC SIMNORMAL to generate multivariate normal data
Recall that you can use the standard deviations and correlations to construct a covariance matrix. When you call PROC SIMNORMAL, it internally constructs the covariance matrix from the information in the OutCorr data set and use the mean and covariance matrix to simulate multivariate normal data. The following call to PROC SIMNORMAL simulates 50 observations from a multivariate normal population. The DATA step combines the original and simulated data; the call to PROC SGSCATTER overlays the original and the simulated samples. Click to enlarge the graph.
proc simnormal data=OutCorr outsim=SimMVN numreal = 50 /* number of realizations = size of sample */ seed = 12345; /* random number seed */ var PetalLength PetalWidth SepalLength SepalWidth; run; /* combine the original data and the simulated data */ data Both; set sashelp.iris(where=(Species="Versicolor")) /* original */ SimMVN(in=sim); /* simulated */ Simulated = sim; run; ods graphics / attrpriority=none; /* use different markers for each group */ title "Overlay of Original and Simulated MVN Data"; proc sgscatter data=Both; matrix PetalLength PetalWidth SepalLength SepalWidth / group=Simulated; run; ods graphics / attrpriority=none; /* reset markers */ |
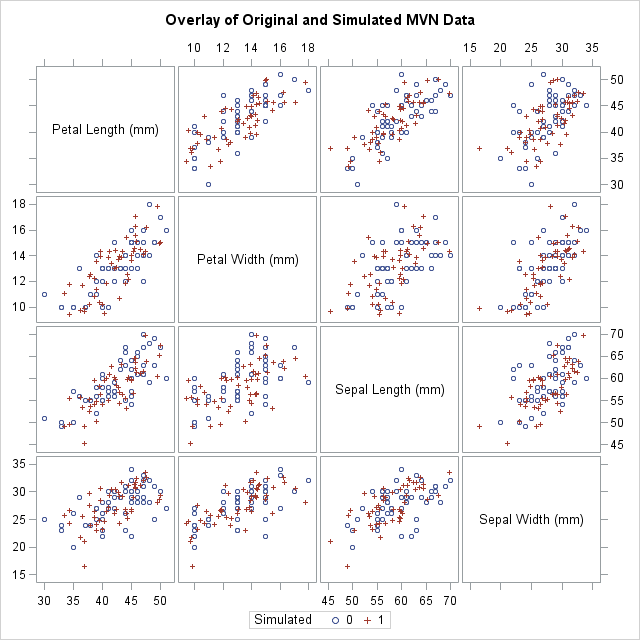
Notice that the original data are rounded whereas the simulated data are not. Except for that minor difference, the simulated data appear to be similar to the original data. Of course, the simulated data will not match unless the original data is approximately multivariate normal.
Simulate many samples from a multivariate normal distribution
The SIMNORMAL procedure supports the NUMREAL= option, which you can use to specify the size of the simulated sample. (NUMREAL stands for "number of realizations," which is the number of independent draws.) You can use this option to generate multiple samples from the same multivariate normal population. For example, suppose you are conducting a Monte Carlo study and you want to generate 100 samples of size N=50, each drawn from the same multivariate normal population. This is equivalent to drawing 50*100 observations where the first 50 observations represent the first sample, the next 50 observations represent the second sample, and so on. The following statements generate 50*100 observations and then construct an ID variable that identifies each sample:
%let N = 50; /* sample size */ %let NumSamples = 100; /* number of samples */ proc simnormal data=OutCorr outsim=SimMVN numreal = %sysevalf(&N*&NumSamples) seed = 12345; /* random number seed */ var PetalLength PetalWidth SepalLength SepalWidth; run; data SimMVNAll; set SimMVN; ID = floor((_N_-1) / &N) + 1; /* ID = 1,1,...,1, 2,2,...,2, etc */ run; |
After adding the ID variable, you can efficiently analyze all samples by using a single call to a procedure. The procedure should use a BY statement to analyze each sample. For example, you could use PROC CORR with a BY ID statement to obtain a Monte Carlo estimate of the sampling distribution of the correlation for multivariate normal data.
In summary, although the SAS/IML language is the best tool for general multivariate simulation tasks, you can use the SIMNORMAL procedure in SAS/STAT software to simulate multivariate normal data. The key is to construct a TYPE=CORR or TYPE=COV data set, which is then processed by PROC SIMNORMAL.

6 Comments
Supposing I have simulated 100 samples of size 50 each, I want to perform a matching or stratification procedure, how do I get the matched groups for each sample separately? Also, how do I obtain an average value of estimated parameters, like R-squared values for example?
Thanks for writing. You are asking a complex question. If you are interested in SAS code, I suggest you post your question (and sample code) to the SAS Support Communities. If you are interested in a statistical response, I suggest posting to CrossValidated.
Amazing, you just solved a problem that I was trying to solve for months!
thank you very much!
Ricardo.
Glad to be of help. You can always ask for help on the SAS Support Communities when you are stuck and need help. The Support Communities might save you time in the future.
Do you think I can simulate longitudinal
data with ARMR error insas? If yes, then how? Thank you for your response of you answer it.
I assume you mean ARMA? Yes, the easiest way is to use the ARMASIM function in SAS/IML. You can also simulate AR or MA terms in the SAS DATA step, as shown in the documentation for PROC ARIMA. If you have further questions, please post them to the SAS Support Community.