My previous post described the multinomial distribution and showed how to generate random data from the multinomial distribution in SAS by using the RANDMULTINOMIAL function in SAS/IML software. The RANDMULTINOMIAL function is simple to use and implements an efficient algorithm called the sequential conditional marginal method (see Gentle (2003), p. 198–199). This algorithm is efficient even when the N parameter in the multinomial distribution is large.
If you do not have SAS/IML software, you can use the DATA step to simulate multinomial data in SAS. The most straightforward way is to simulate N draws from k categorical values and count the number of draws in each category. This is not as efficient as the algorithm that the RANDMULTINOMIAL function uses, but you can use this alternative method when N is small.
The following DATA step uses the "Table" distribution to generate categorical data according to specified probabilities and counts the number of each category:
%let SampleSize = 1000; %let NumTrials = 100; /* Generate multinomial data when NumTrials is not large */ data multinomial(drop=i j); array probs{3} _temporary_ (0.5 0.2 0.3); /* prob of i_th category */ array x{3} x1-x3; /* store counts */ call streaminit(1234); do Replicate = 1 to &SampleSize; do i = 1 to dim(x); x[i] = 0; end; /* zero the counts */ do i = 1 to &NumTrials; j = rand("table", of probs[*]); /* category 1-k */ x[j]+1; /* increment count */ end; output; end; run; proc print data=multinomial(obs=10) noobs; var Replicate x:; run; |
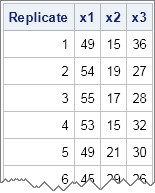
In the DATA step, the RAND function generates a random number in the range 1–k, where k = 3 for this example. An array keeps track of the count of each category. Each row of the resulting data set contains one observation from the multinomial distribution. Each row sums to &NumTrials, which is 100 for this example.
Each row can be interpreted as the result of drawing 100 items (with replacement) from a box that contains items of three colors. The first row is interpreted as drawing 49 items of the first color, 15 items of the second color, and 36 items of the third color. The second row represents a second independent draw of 100 items.
I've seen many variations on this DATA step technique over the years, but recently I saw a blog post by Simon Huang that uses the SURVEYSELECT procedure instead of the DATA step. The idea is to specify the vector of probabilities in a data set and then use PPS (probability proportional to size) sampling to sample with replacement. The SIZE statement specifies the variable in the data set that contains the sampling probabilities, as follows:
/* define a data set that contains the categories and probabilities */ data Probs; array probs{3} _temporary_ (0.5 0.2 0.3); do x = 1 to dim(probs); prob = probs{x}; output; end; %let SampleSize = 1000; %let NumTrials = 100; proc surveyselect data=Probs noprint seed=1234 method=pps_wr out=sample(drop=prob ExpectedHits SamplingWeight) reps = &SampleSize /* number of observations from multinomial distribution */ N = &NumTrials; /* number of trials */ id x; size prob; run; |
The SURVEYSELECT procedure creates an output data set in "long" form. The data set contains three variables: the variable Replicate contains the values 1–1000, the variable x contains the categories 1,2,...,k, and the variable NumberHits contains the number of times that category i was drawn out of N trials.
You can use PROC TRANSPOSE to convert the data set from long to wide form, as follows:
/* long to wide transpose */ proc transpose data=sample out=multinomial prefix=x; by Replicate; id x; var NumberHits; run; proc print data=multinomial(obs=10) noobs; var Replicate x:; run; |
The resulting data set is identical to the data set that is created by the DATA step, provided that no category has zero counts. If a category for some trial has zero counts, the TRANSPOSE procedure will insert a missing value instead of a zero. (To see this, use %let NumTrials = 100;) If your application requires a zero instead of a missing value, use a subsequent DATA step (not shown) to convert the missing values to zeros, or just use the DATA step program at the beginning of this article.

5 Comments
Pingback: The best articles of 2013: Twelve posts from The DO Loop that merit a second look - The DO Loop
Pingback: Simulate from the multinomial distribution in SAS - The DO Loop
Pingback: Sample with replacement and unequal probability in SAS - The DO Loop
Pingback: Simulate from the multinomial distribution in the SAS DATA step - The DO Loop
Pingback: Four essential sampling methods in SAS - The DO Loop